
Carbon Beauty
Composite Airframe Demonstrator
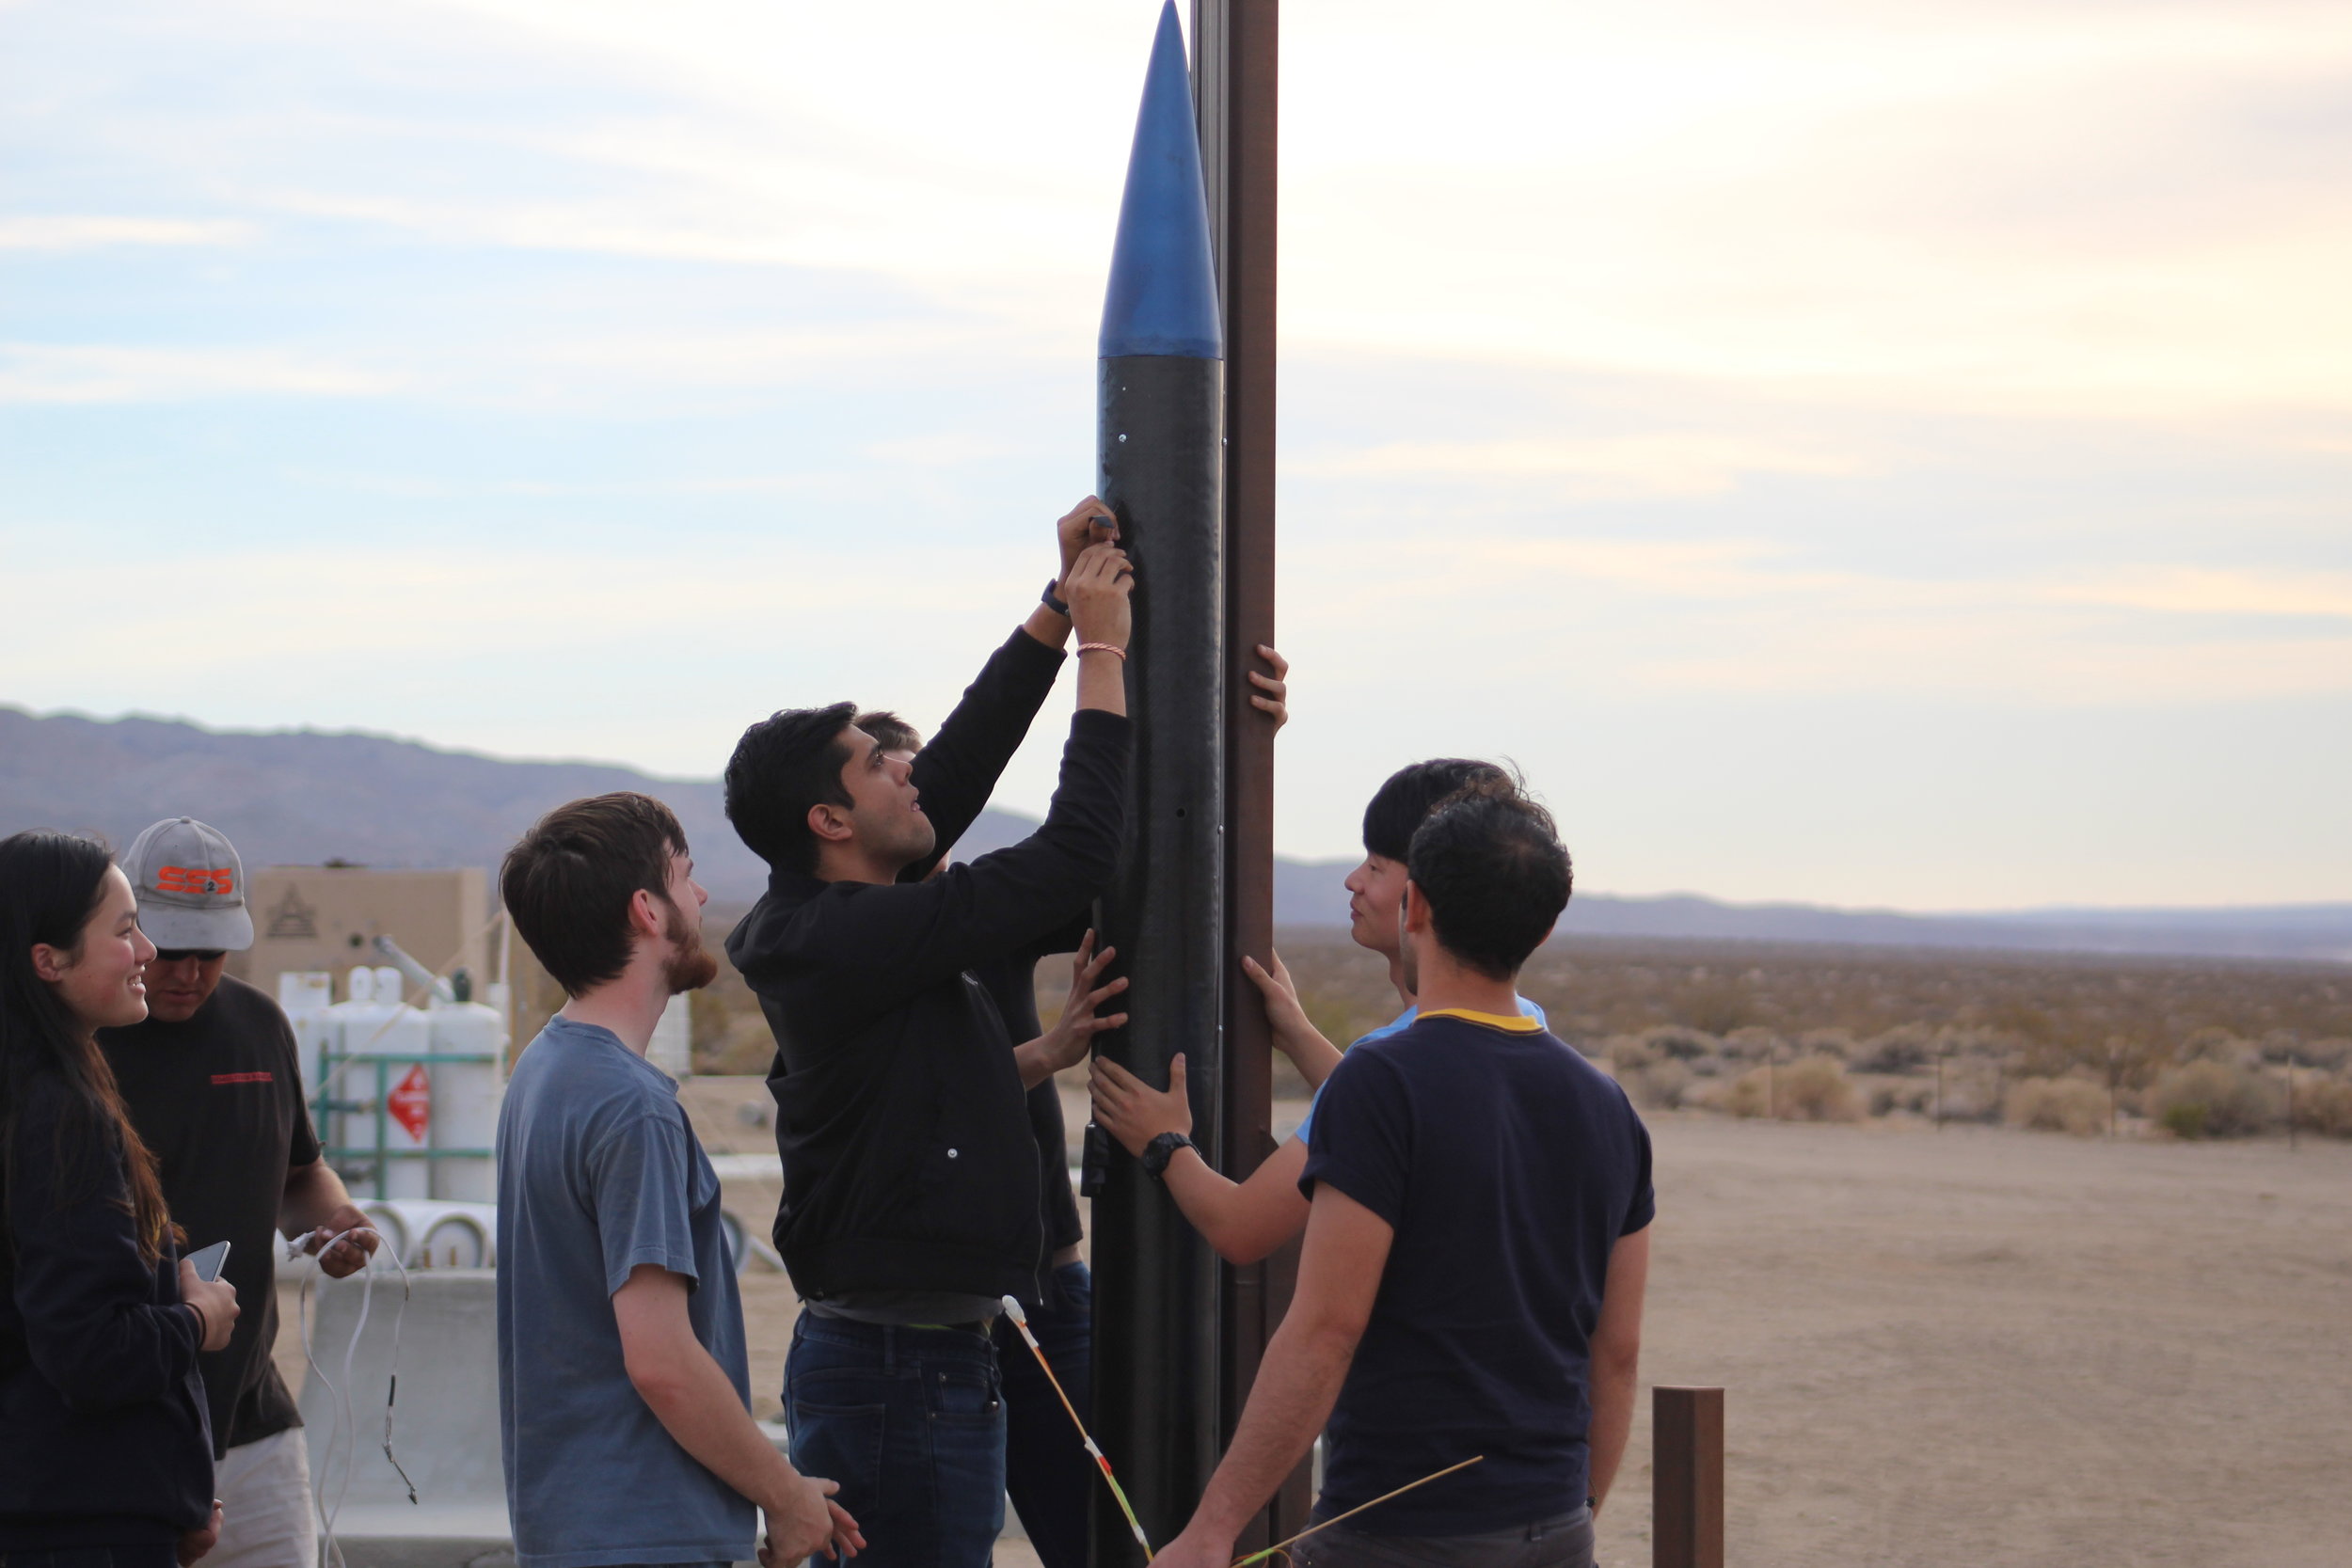
To validate and test composite fabrication techniques intended for Eureka (hypersonic space shot rocket), I led design, construction, and flight operations of the “Low Altitude Demonstrator 001 - Sparky”. The rocket used an all-composite airframe comprised of carbon fiber and fiberglass, and utilized wet layup, vacuum bagging, and cored composite construction using wood.
While only a demonstrator, Sparky set U.C. Berkeley records for both altitude (6,000 ft) and maximum velocity (Mach 0.68), supplanting previous records by CalSTAR of 5,800 ft and Mach 0.5.
ALL-COMPOSITE AIRFRAME
Sparky was built primarily using carbon fiber, fiberglass, and custom-made glass-fiber-reinforced-polymer (GFRP) in a process that I developed at Space Enterprise at Berkeley by adapting previous fiber reinforcement techniques.
The fuselage was built of 6 layers of composite, each using wet layup, in an I-Beam configuration with 2 layers of woven carbon fiber on the interior and exterior sandwiching 2 layers of woven fiberglass.
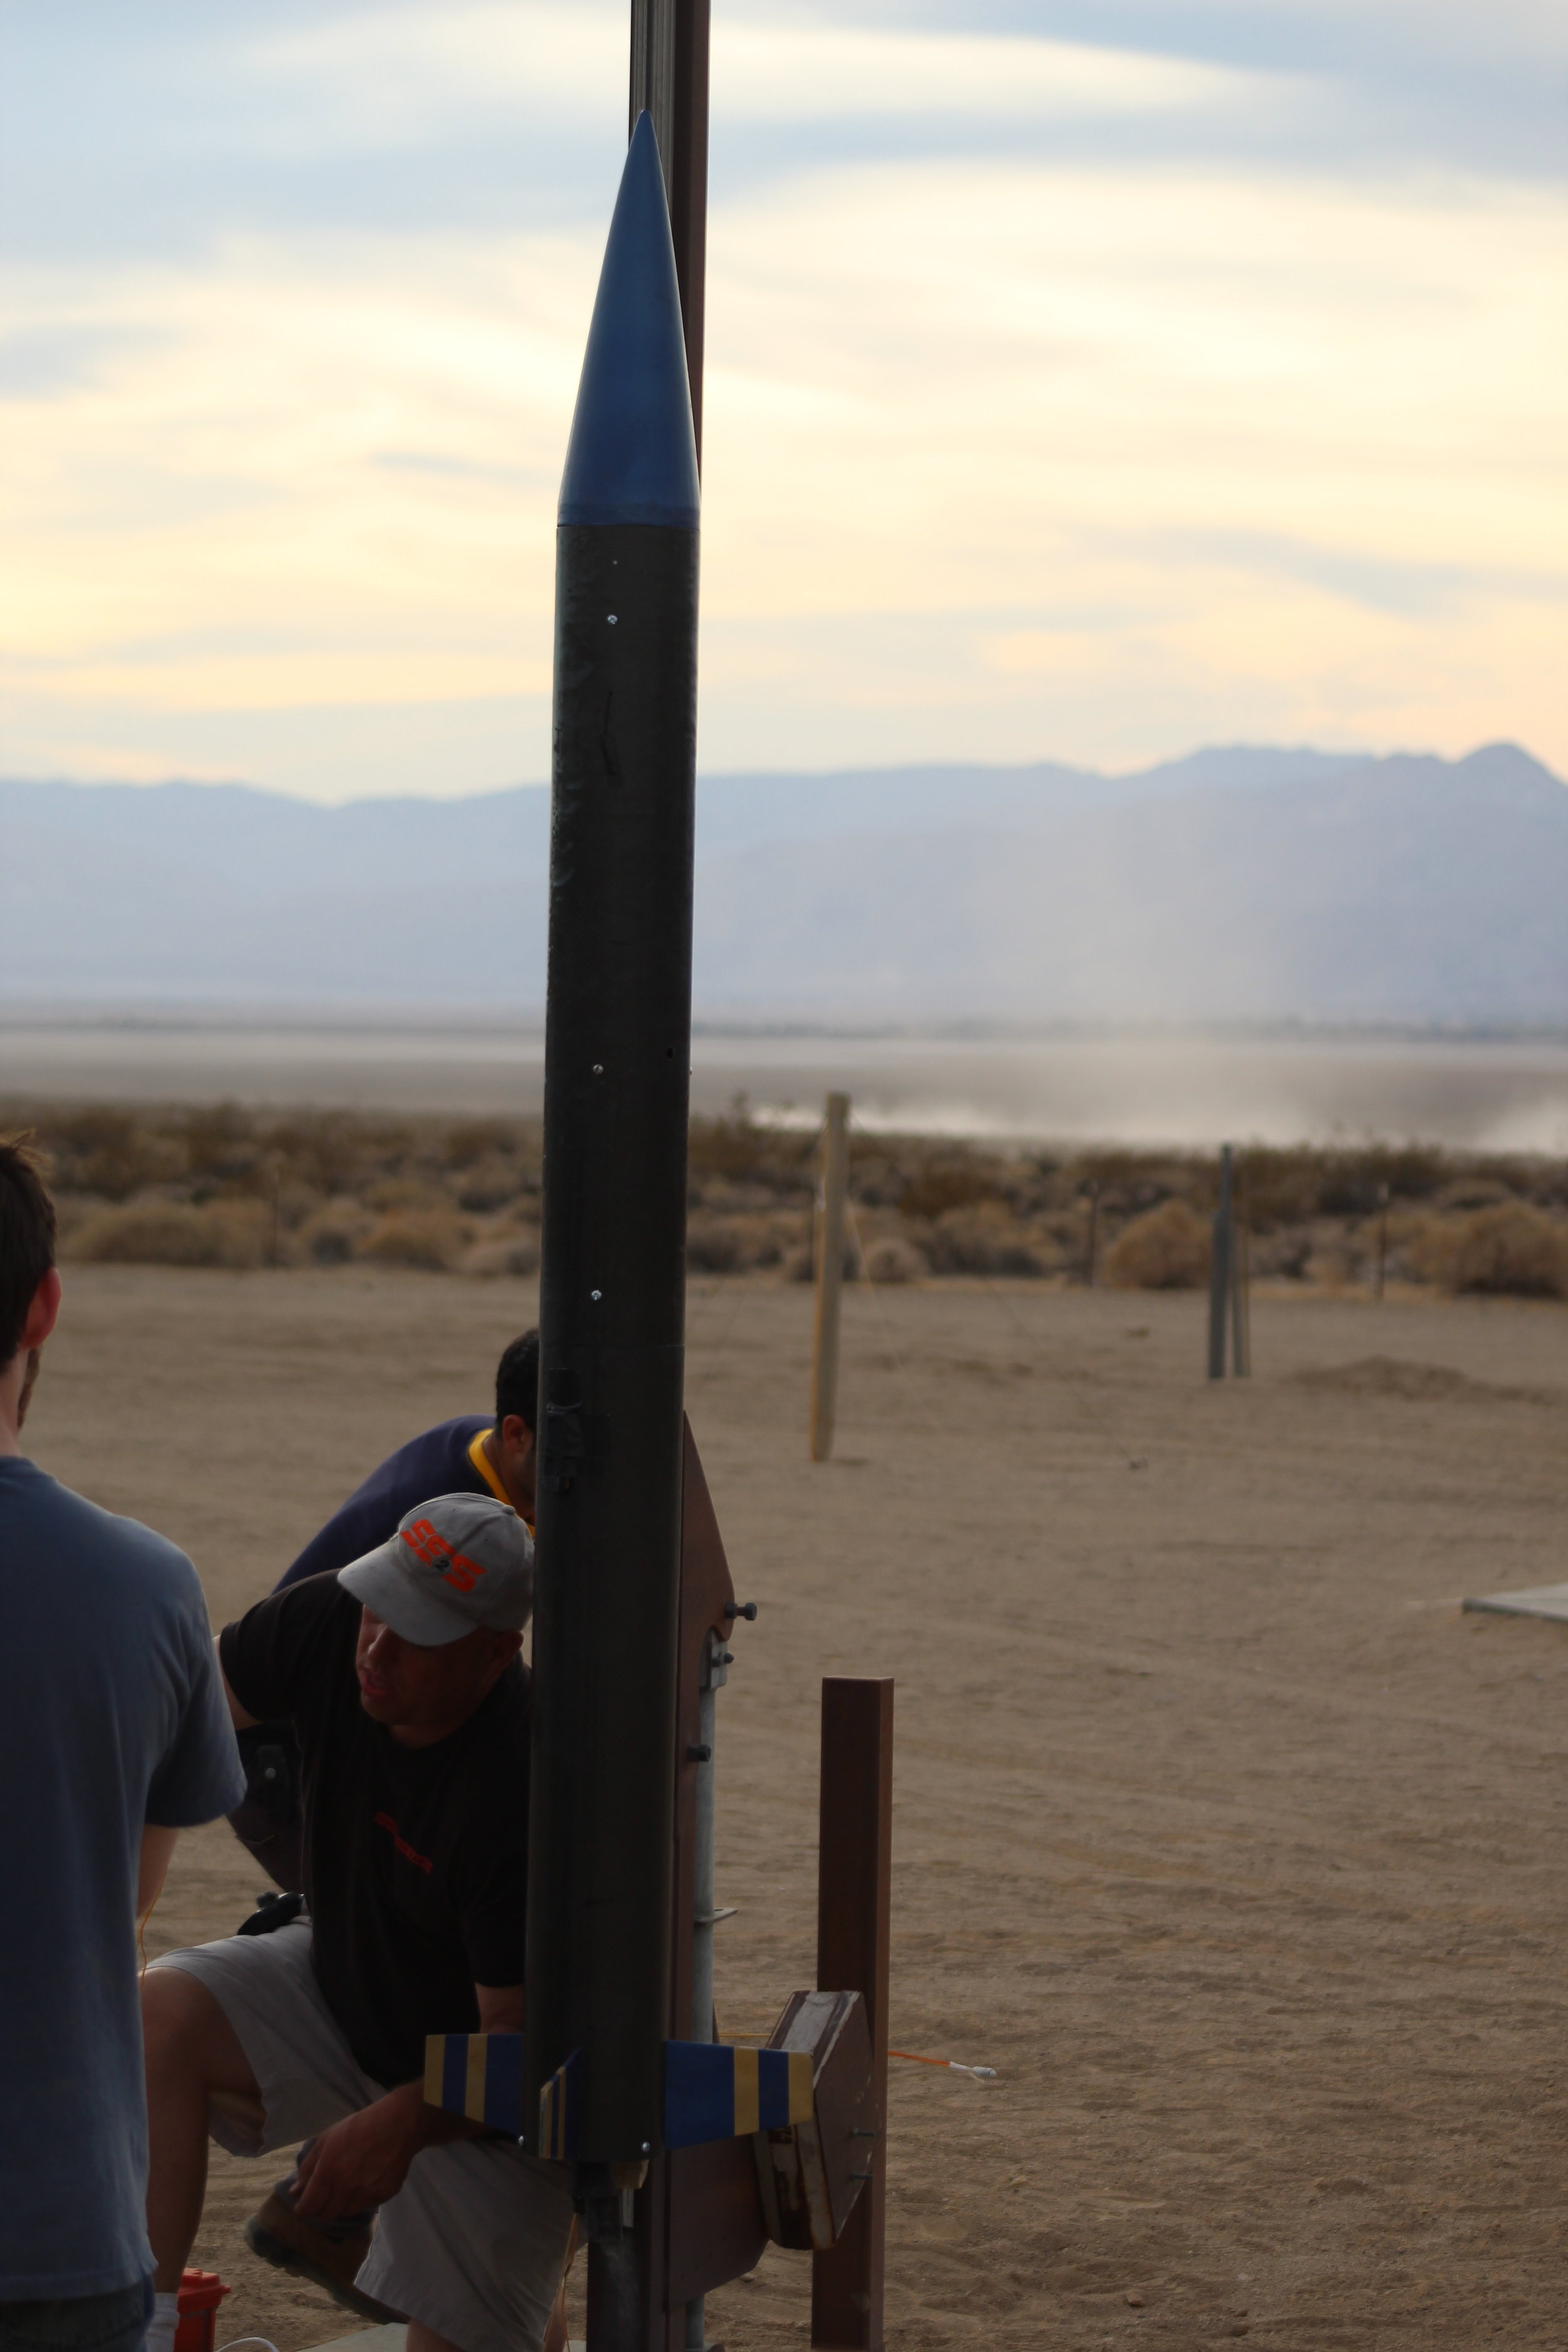
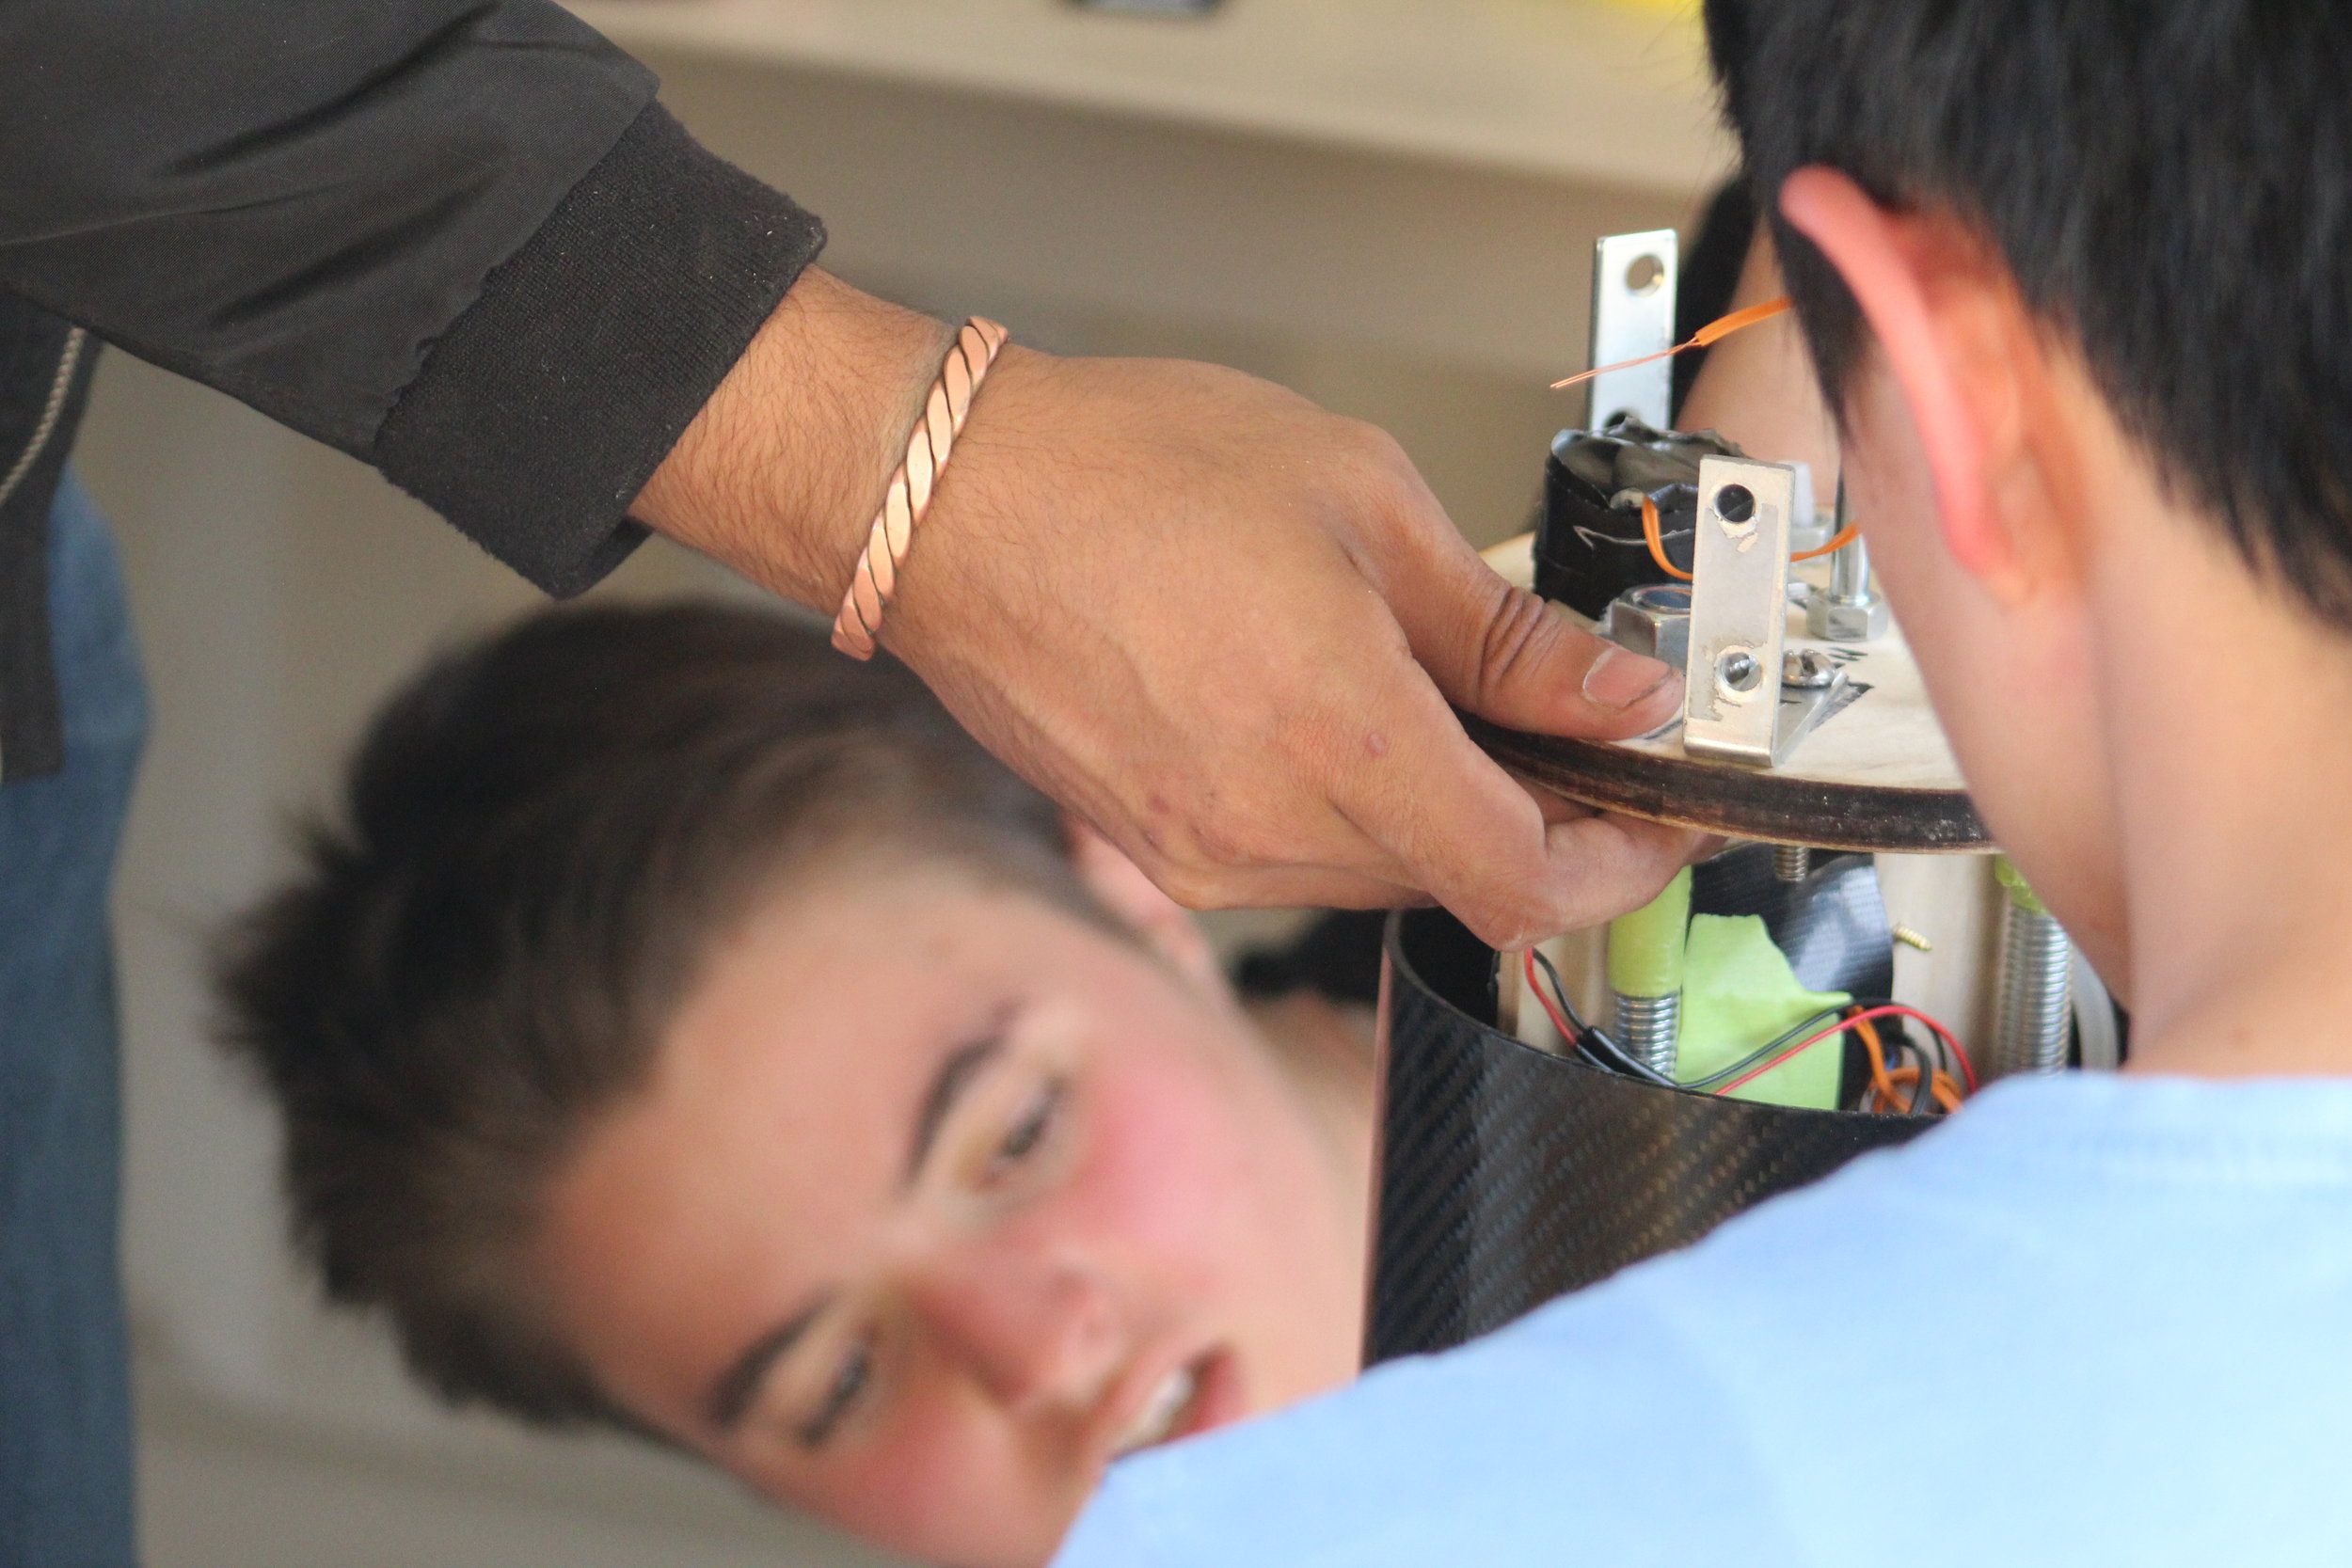
In the above image, I make an… interesting… face while arming the backup parachute deployment mechanism - a Perfectflite Stratologger hooked up to a small electric squib and black powder charge. The Stratologger is set to go off 2 seconds after apogee and serves as an insurance policy in case our custom avionics system fails.
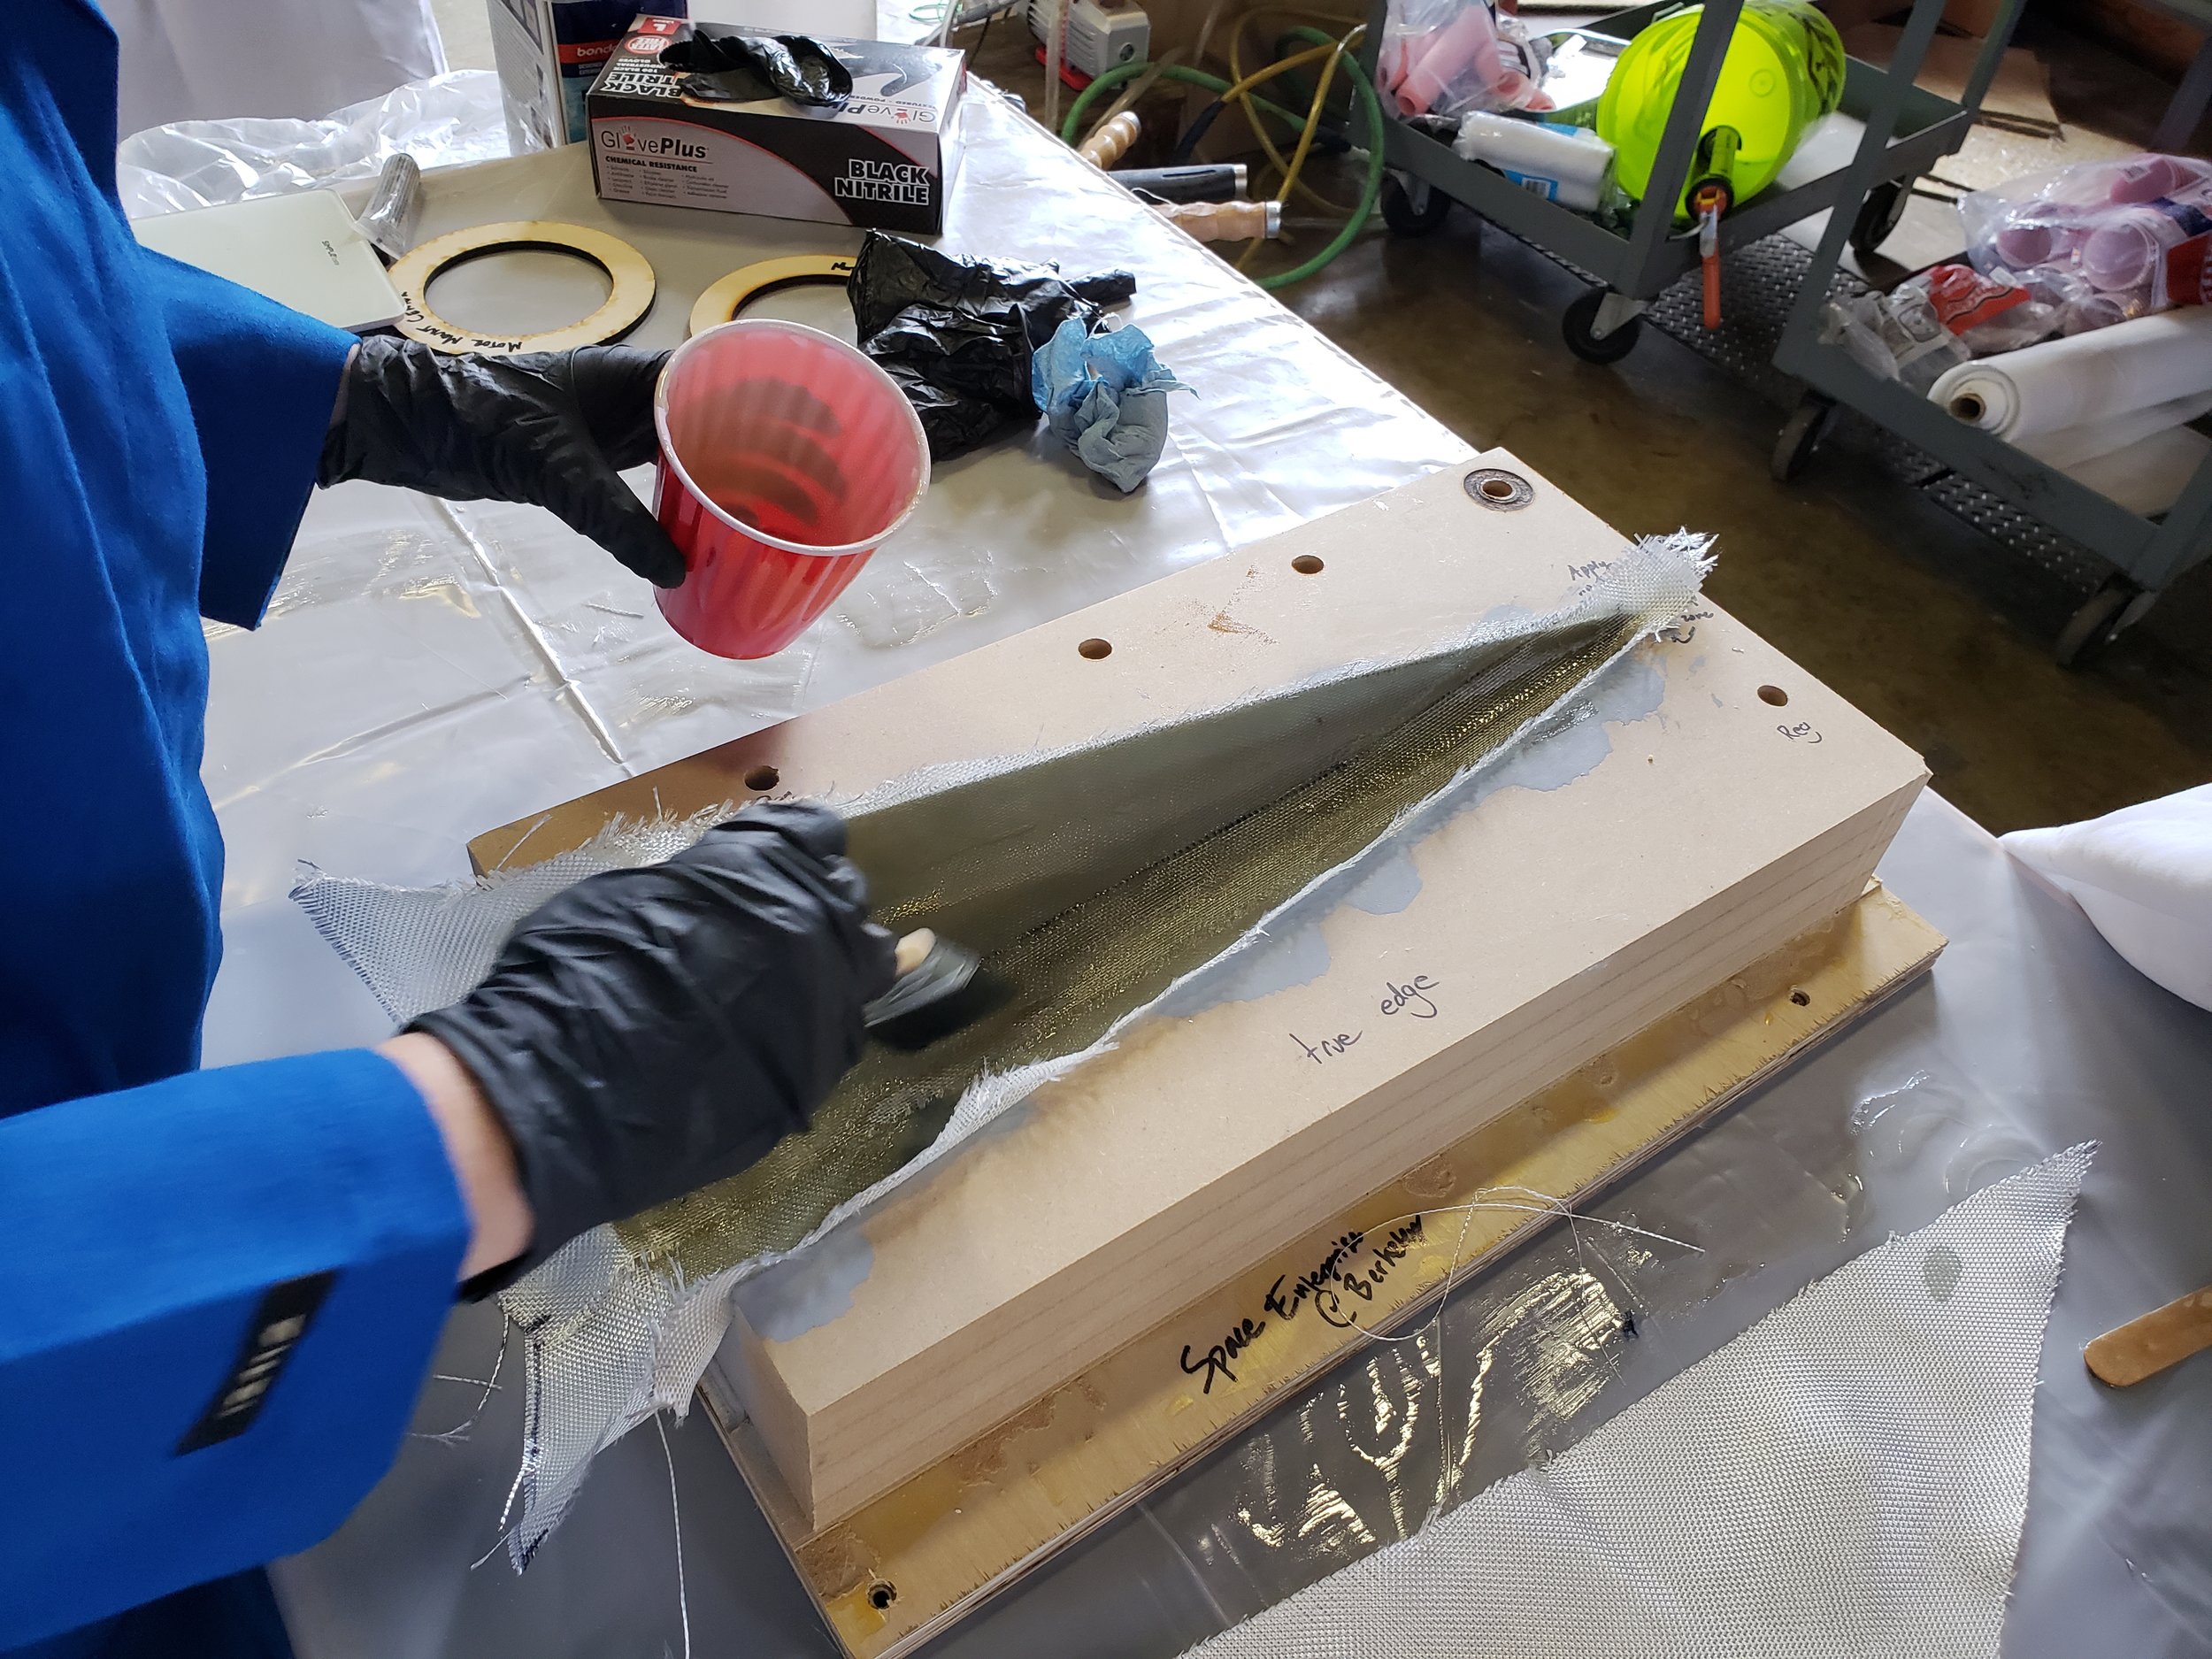
Nose Cone Layups
Using CNC-ed MDF negative molds, a we laid up fiberglass sheets to form the contour of the nose cone. While the first sheets laid down (outermost) utilized a dense fiberglass weave, we saved cost and time by utilizing fiberglass mat as a thickener and internal structural reinforcement material.
My primary responsibilities included CAD modeling of the nose cone contour, preparation of MDF molds, and providing advice and guidance to new members, who were tasked with performing the layup and operating the ShopBot CNC router.
The nose cone came together nicely, but next time, we will definitely use a more durable mold material than MDF. While it produced gorgeous parts, the finely machined surface was left ragged and damaged after parts were demolded.
Avionics Bay Woes
Design of a combined barometric/accelerometric altimeter and recovery system was assigned as project for new members, but the day before launch day, they shorted out their Raspberry Pi, backup Raspberry Pi, and barometer during testing.
In a rush, I cannibalized components and code from my Athletic Performance Tracker, coding a new flight dynamics package for Arduino and implementing multi-redundant accelerometric apogee detection systems in less than 6 hours between 11pm and 5am before catching a quick nap and beginning the drive to the Mojave.
During flight, the system performed perfectly, initiating the signal to deploy the parachute approximately half a second after apogee, as designed.

ALL SYSTEMS NOMINAL* (Exceptions may apply)
Sparky had a gorgeous flight, accelerating straight off the pad and flying perfectly straight up to an apogee of approximately 6,000 ft as recorded by the on board backup altimeter. During its flight it achieved a maximum estimated velocity of Mach 0.68 and soared high above the Mojave Desert, capturing the sunset as it flew.
Unfortunately, upon reaching apogee, the shear pins designed to cleanly separate the nose cone bent instead of snapping in shear, resulting in a leak in the parachute bay, which prevented a proper nose cone separation.
In the future, we will switch from bulk-purchased nylon shear pins to aluminum shear pins, which will have more consistent and predictable shear properties.
TIS NOTHING BUT A FLESH WOUND
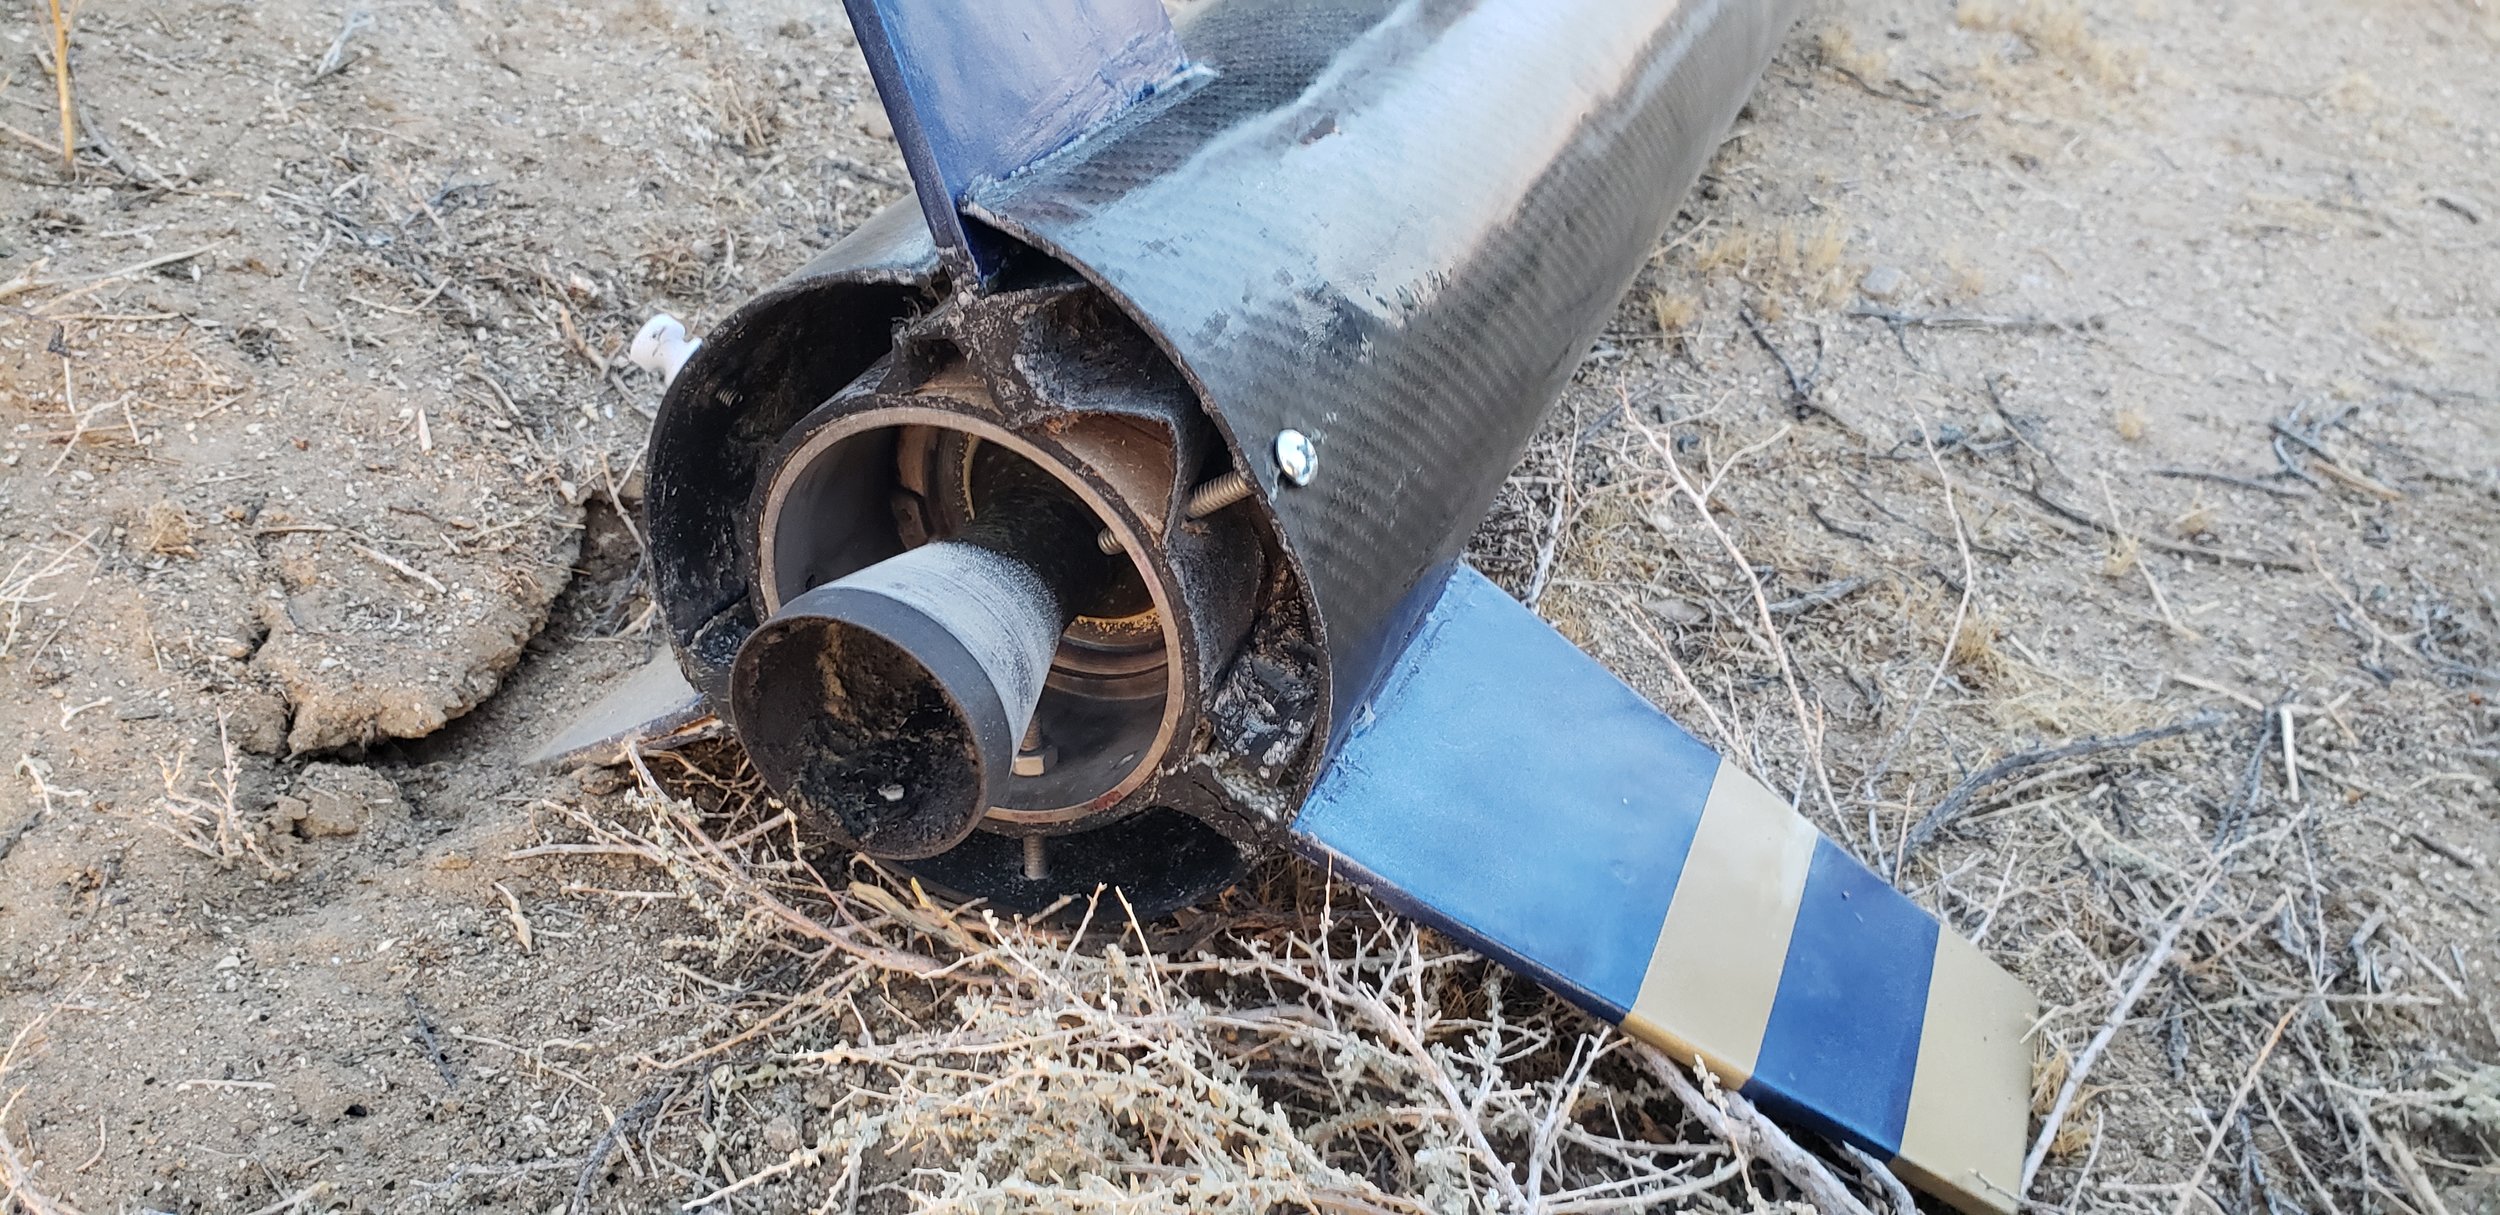
Escaping high-pressure gas from the nose cone sent the rocket into a flat spin on its way down, causing it to impact the ground flat instead of the typical “lawn dart” nose-down configuration.
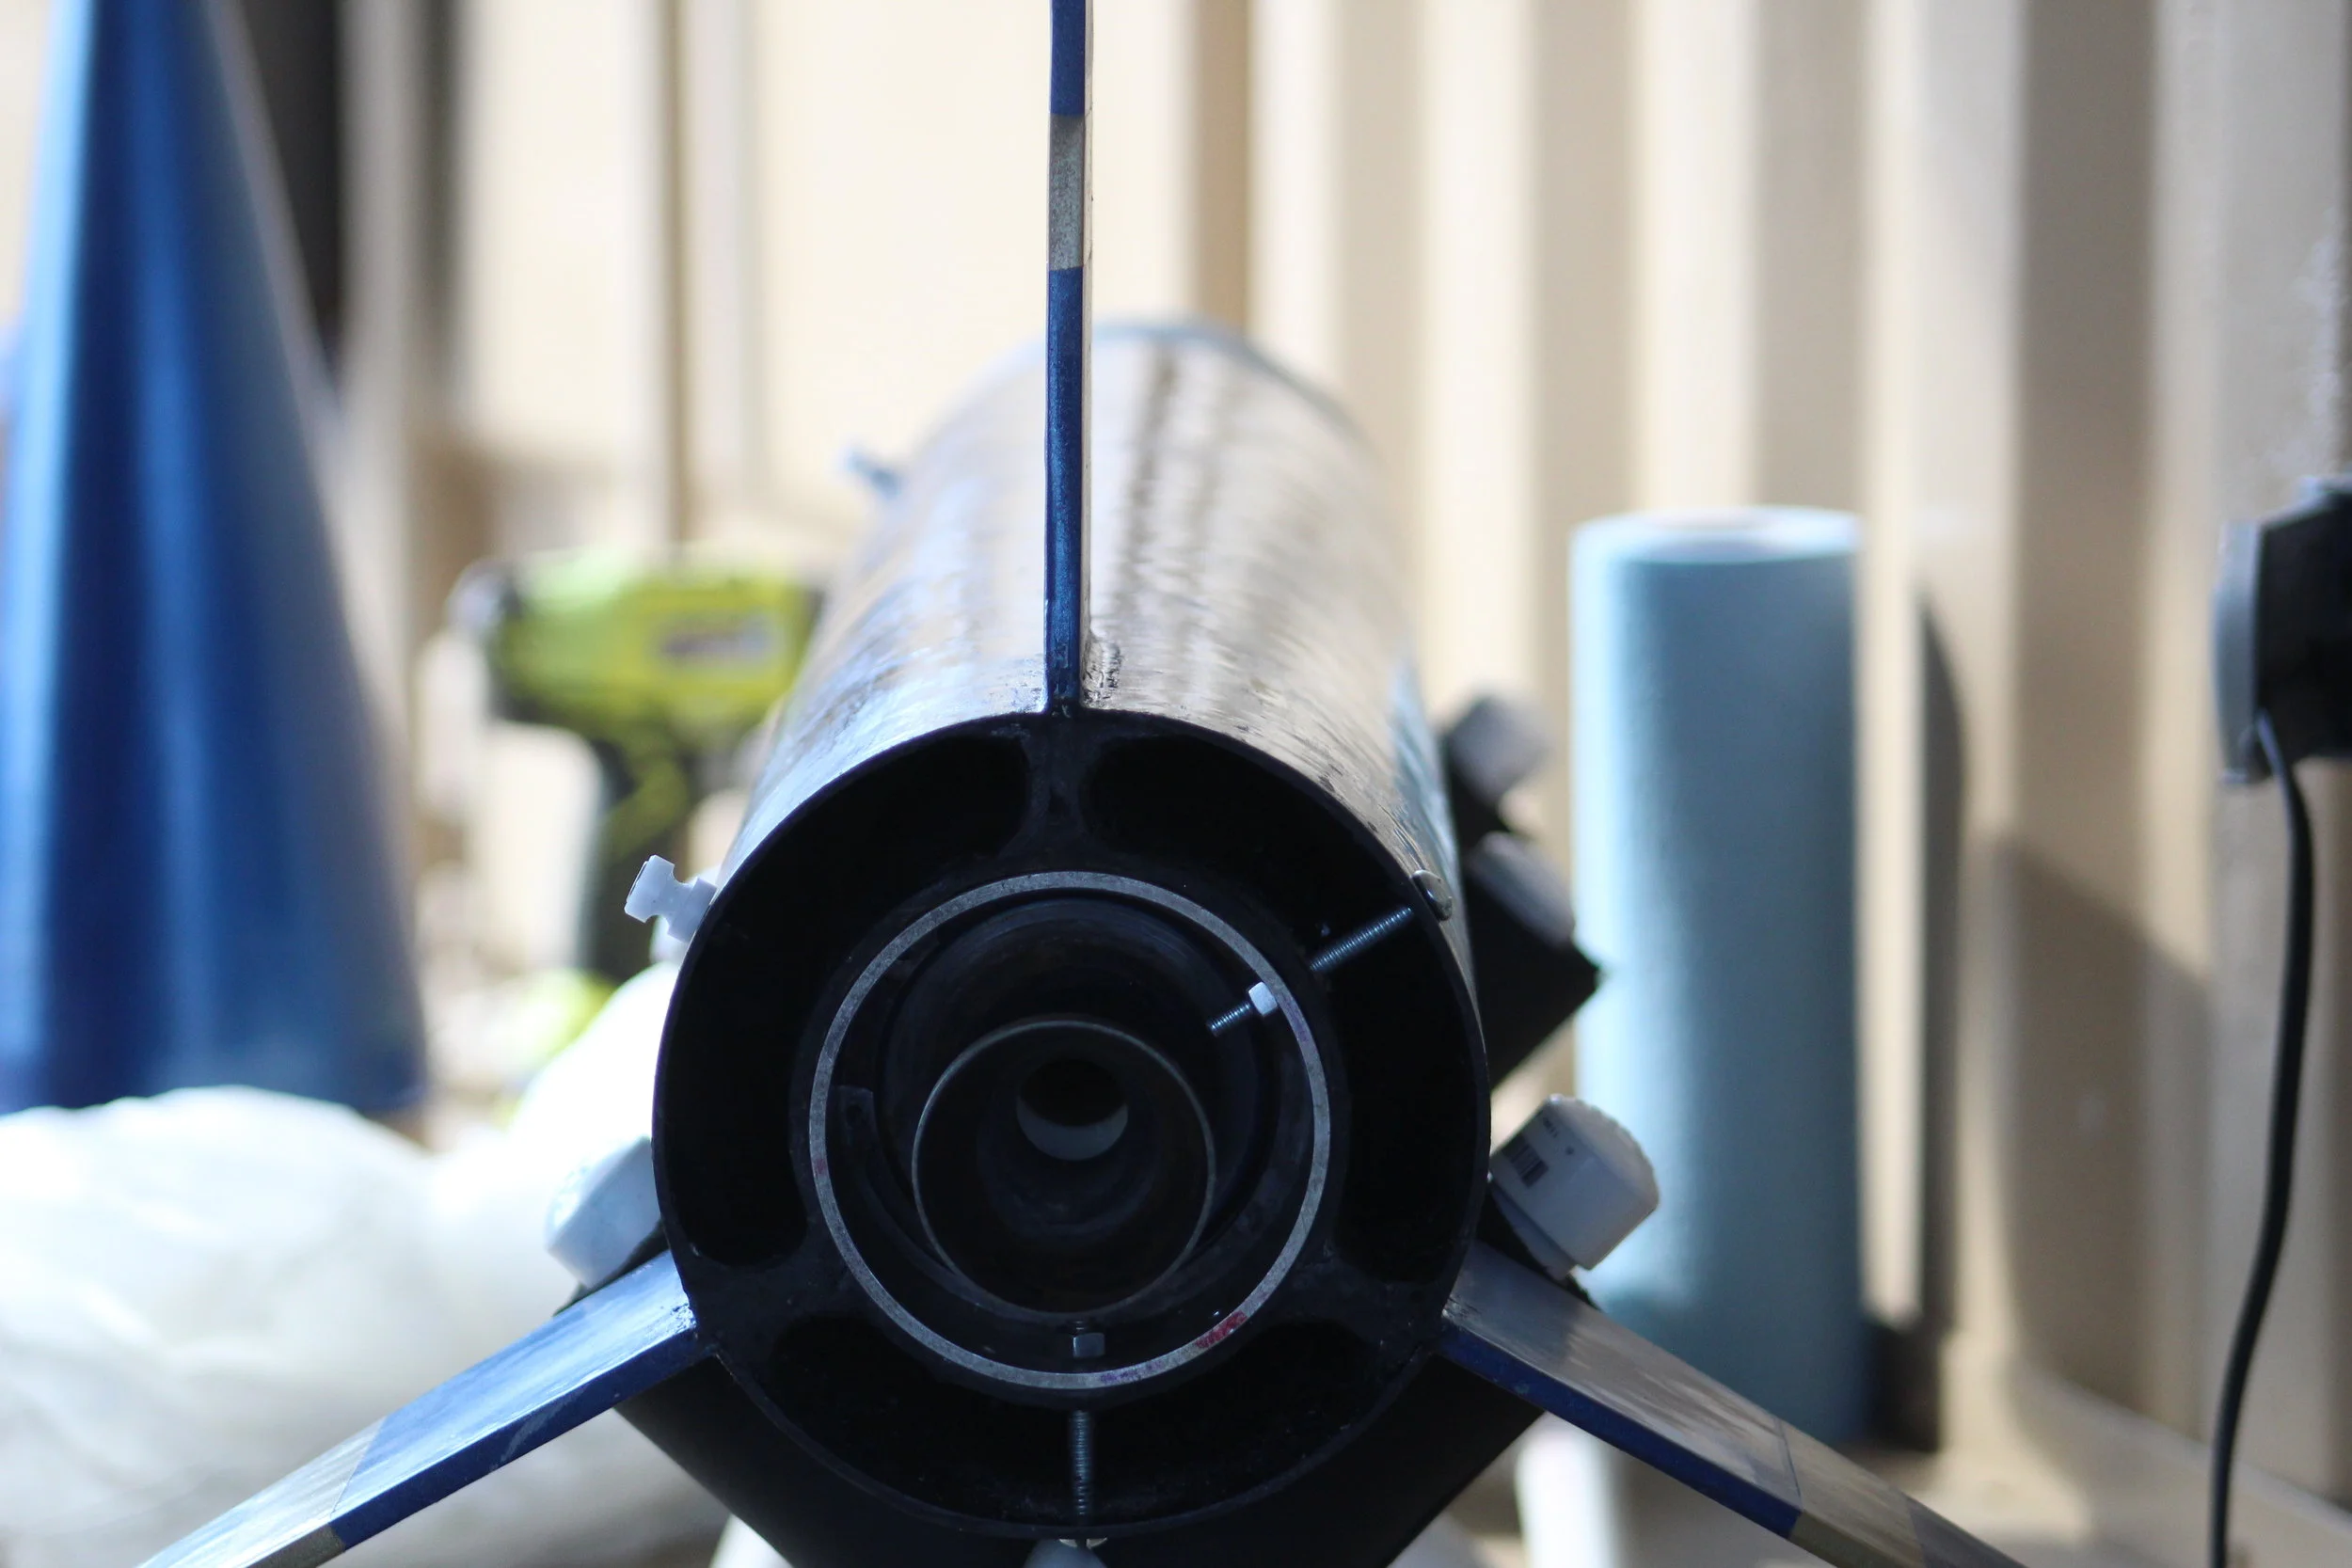
In a pleasant surprise that confirmed our faith in our composite fabrication, my custom GFRP fin joints (black components between the inner and outer tube) survived the fall and remained intact (except for one which sheared away from the disposable outer motor case).
Sparky will fly again, we just have to buff out the scratches ;)
Future versions of the GFRP will incorporate more finely chopped fiber, a better method for bonding to unlike materials (something along the lines of JB Weld), and optimized overall mass by using continuous fiber sheets as external reinforcement.
(Mostly) Stocked
Semiconductor Supply Chain Optimization
Modern supply chains for computer processors require increasing speed, efficiency, and reliability to meet the demands of a growing electronics sector and new applications such as embedded and IoT computing. I developed a new set of inventory stocking algorithms based on empirical sales data and Markov Chain estimation to reduce the amount of inventory a major semiconductor manufacturer would need to hold in warehouses to ensure on-time delivery of orders.
My new inventory stocking system reduced required inventory levels by 36% relative to current stocks while maintaining a required 90% service level (90% of all ordered units could be shipped immediately). I also demonstrated statistical confidence in the performance of my model, with a 95% confidence that a 90% service level could be maintained.

Baseline model - static mean estimation
Under the baseline model, the required inventory stocking level was based on the mean order quantity per day and a “days of inventory” decision parameter. For instance, if the mean orders per day were 20,000 units and 4 days of inventory were kept in the warehouse, 80,000 units would be stored at any given time.

Markov chain inventory planner
My Markov Chain model created an entirely new methodology for deciding how to stock the semiconductor warehouse. Instead of calculating a relatively fixed “day” of inventory and multiplying it by the “days of inventory” decision parameter, my model used previous orders to anticipate the size of upcoming orders and stocked the warehouse based on an estimation of the static distribution of the order size Markov chain for n days in advance.
This changed “days of inventory” from a fairly arbitrary decision parameter into a value that had a much more rigorous definition and interpretation.
The average value of products held in stock was reduced by 21% relative to the baseline model while the total quantity of stock was reduced by 36%. This was due to multiple products being stocked in the same warehouse with differing price points.
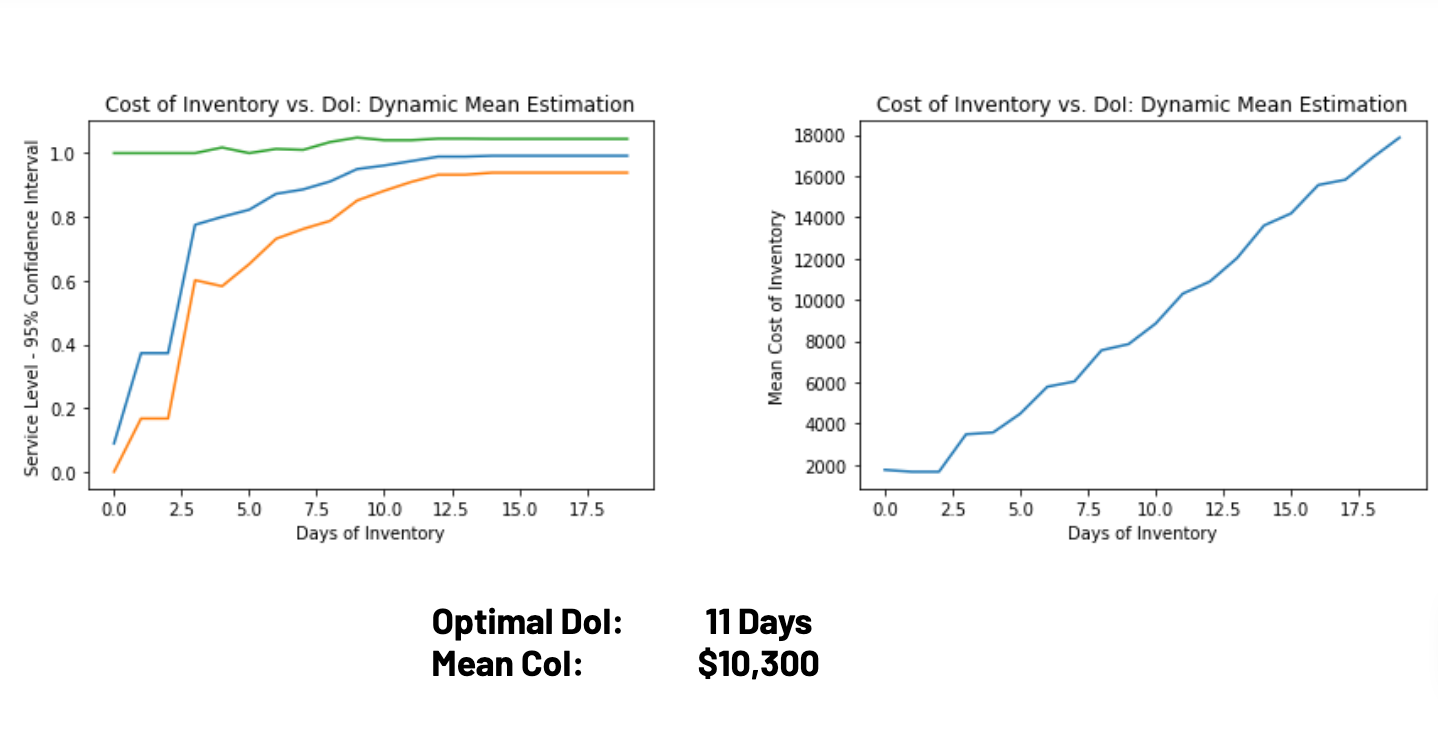
Dynamic mean estimator
I designed a dynamic mean estimator that used a rolling average to compute the size of one “day of inventory”. While it required slightly more inventory to be kept in stock, it improved the linearity and sensitivity response of the system, meaning that changing the “days of inventory” decision parameter resulted in more predictable and controllable changes in service level.

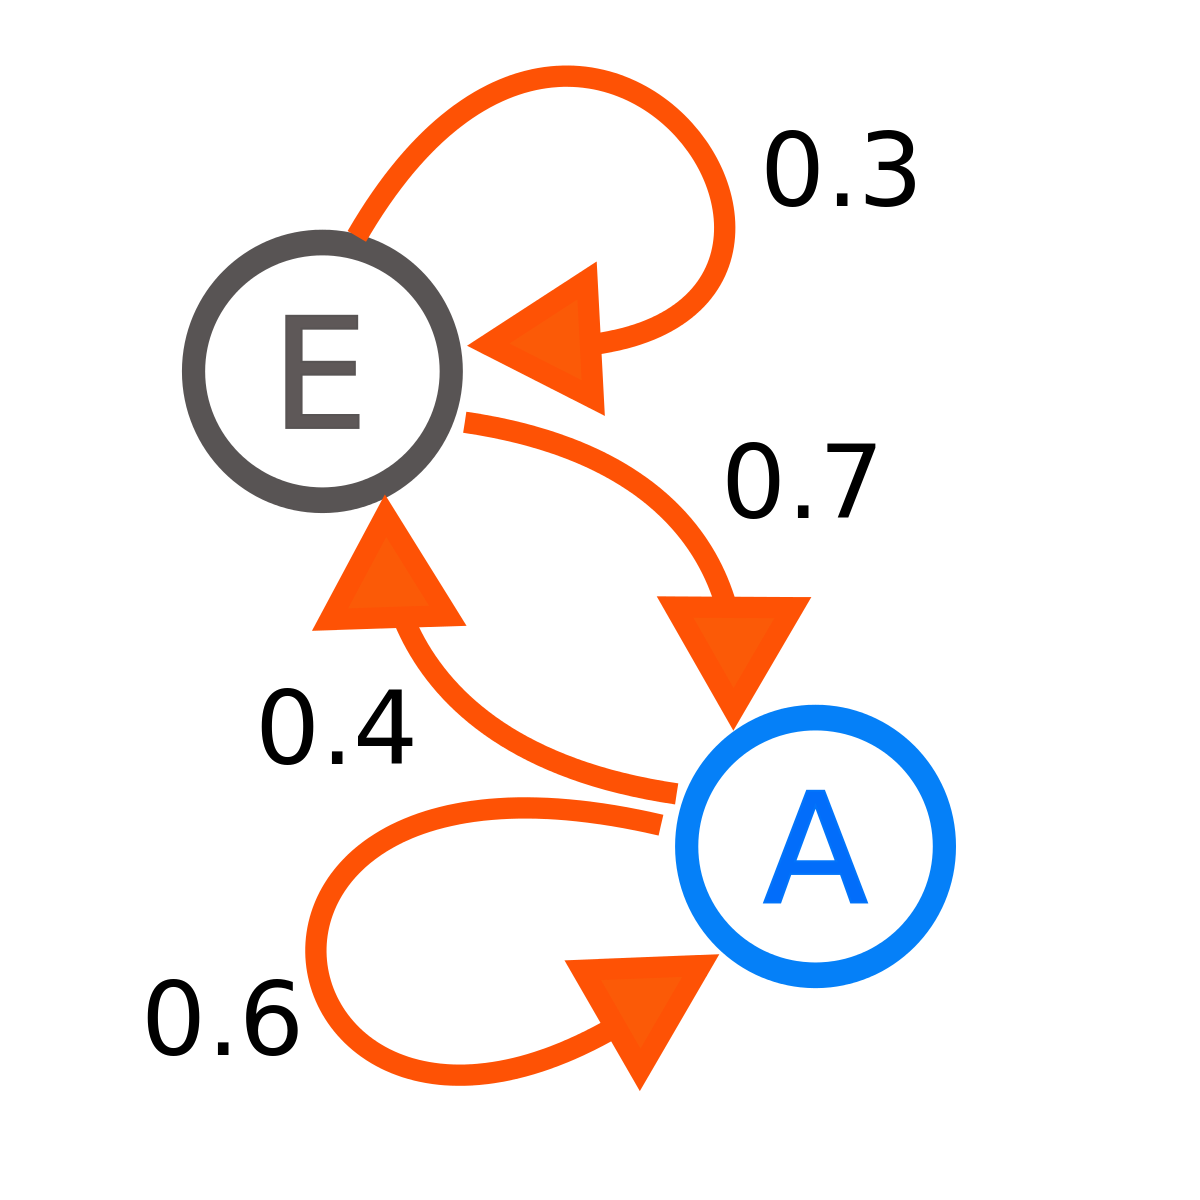
Markov in a nutshell
What is a Markov Chain?
Short Version - if you know the current state of a system (ex. it is raining today), you can use that information to predict both the future state of the system (ex. there is a 15% chance it will rain in 5 days) as well as the long-term distribution of states (ex. it will rain around 6% of the time).
This is an extremeley useful way to model real-world systems, and by applying it to the question of order size estimation, I was able to do a substantially better job of predicting future order sizes than simply looking at the mean and standard deviation.
Guardian Angel -Brought to you by IoT
Athletic Performance Tracker & Injury Prevention
As part of my Industrial Engineering Challenge Lab, I developed a low-cost motion and force tracking system that could deliver insights on athletic performance comparable to high-end products such as Sparta Science’s force plate system. This tracker was wearable, real time, low power, and unobtrusive, allowing athletes to play at their best while still receiving critical data.
This project is underway as a team effort in my IEOR Sports Tech Challenge Lab - a course that pairs engineers with business majors and NCAA athletes to develop innovative solutions for Cal Athletics and the world at large. The technological/coding/data science aspect of the project is entirely my responsibility.

First Working Prototype
Before doing anything else, my first goal was to get three key components of a Minimum Viable Product (MVP) working:
The Arduino should pull accelerometric data from a basic MPU 6050 IMU
The Arduino should transmit the information over bluetooth
The Arduino, Sensor, Bluetooth Module, and Battery should fit on a device that can be worn while walking and doing basic activities
Seeing data pouring in successfully over UART was one of the happiest moments of my semester (does that make me sound lame?). From there, the “only” challenge would be parsing 3-axis acceleration into usable data with value to an end user. Easy, right?

APPROACHING THE PROBLEM
What do coaches and athletes want to know? It turns out, it’s relatively straightforward. Coaches want to know if their athletes are getting balanced training, and athletes want to benchmark their performance and learn how to improve.
After interviewing athletes and coaches, I peeled back the marketing buzz on the industry leader in data-based performance analysis, Sparta Science, and realized that all their flagship plate floor plate sensor is actually doing is measuring three fairly simple quantities using an array of load cells:
“Load” is force applied by the athlete
“Explode” is jerk, or the rate of acceleration
“Drive” is change in momentum, or delivered impulse, over a short time
From there, it was just a matter of hooking up an IMU to a bluetooth module… or so I thought.

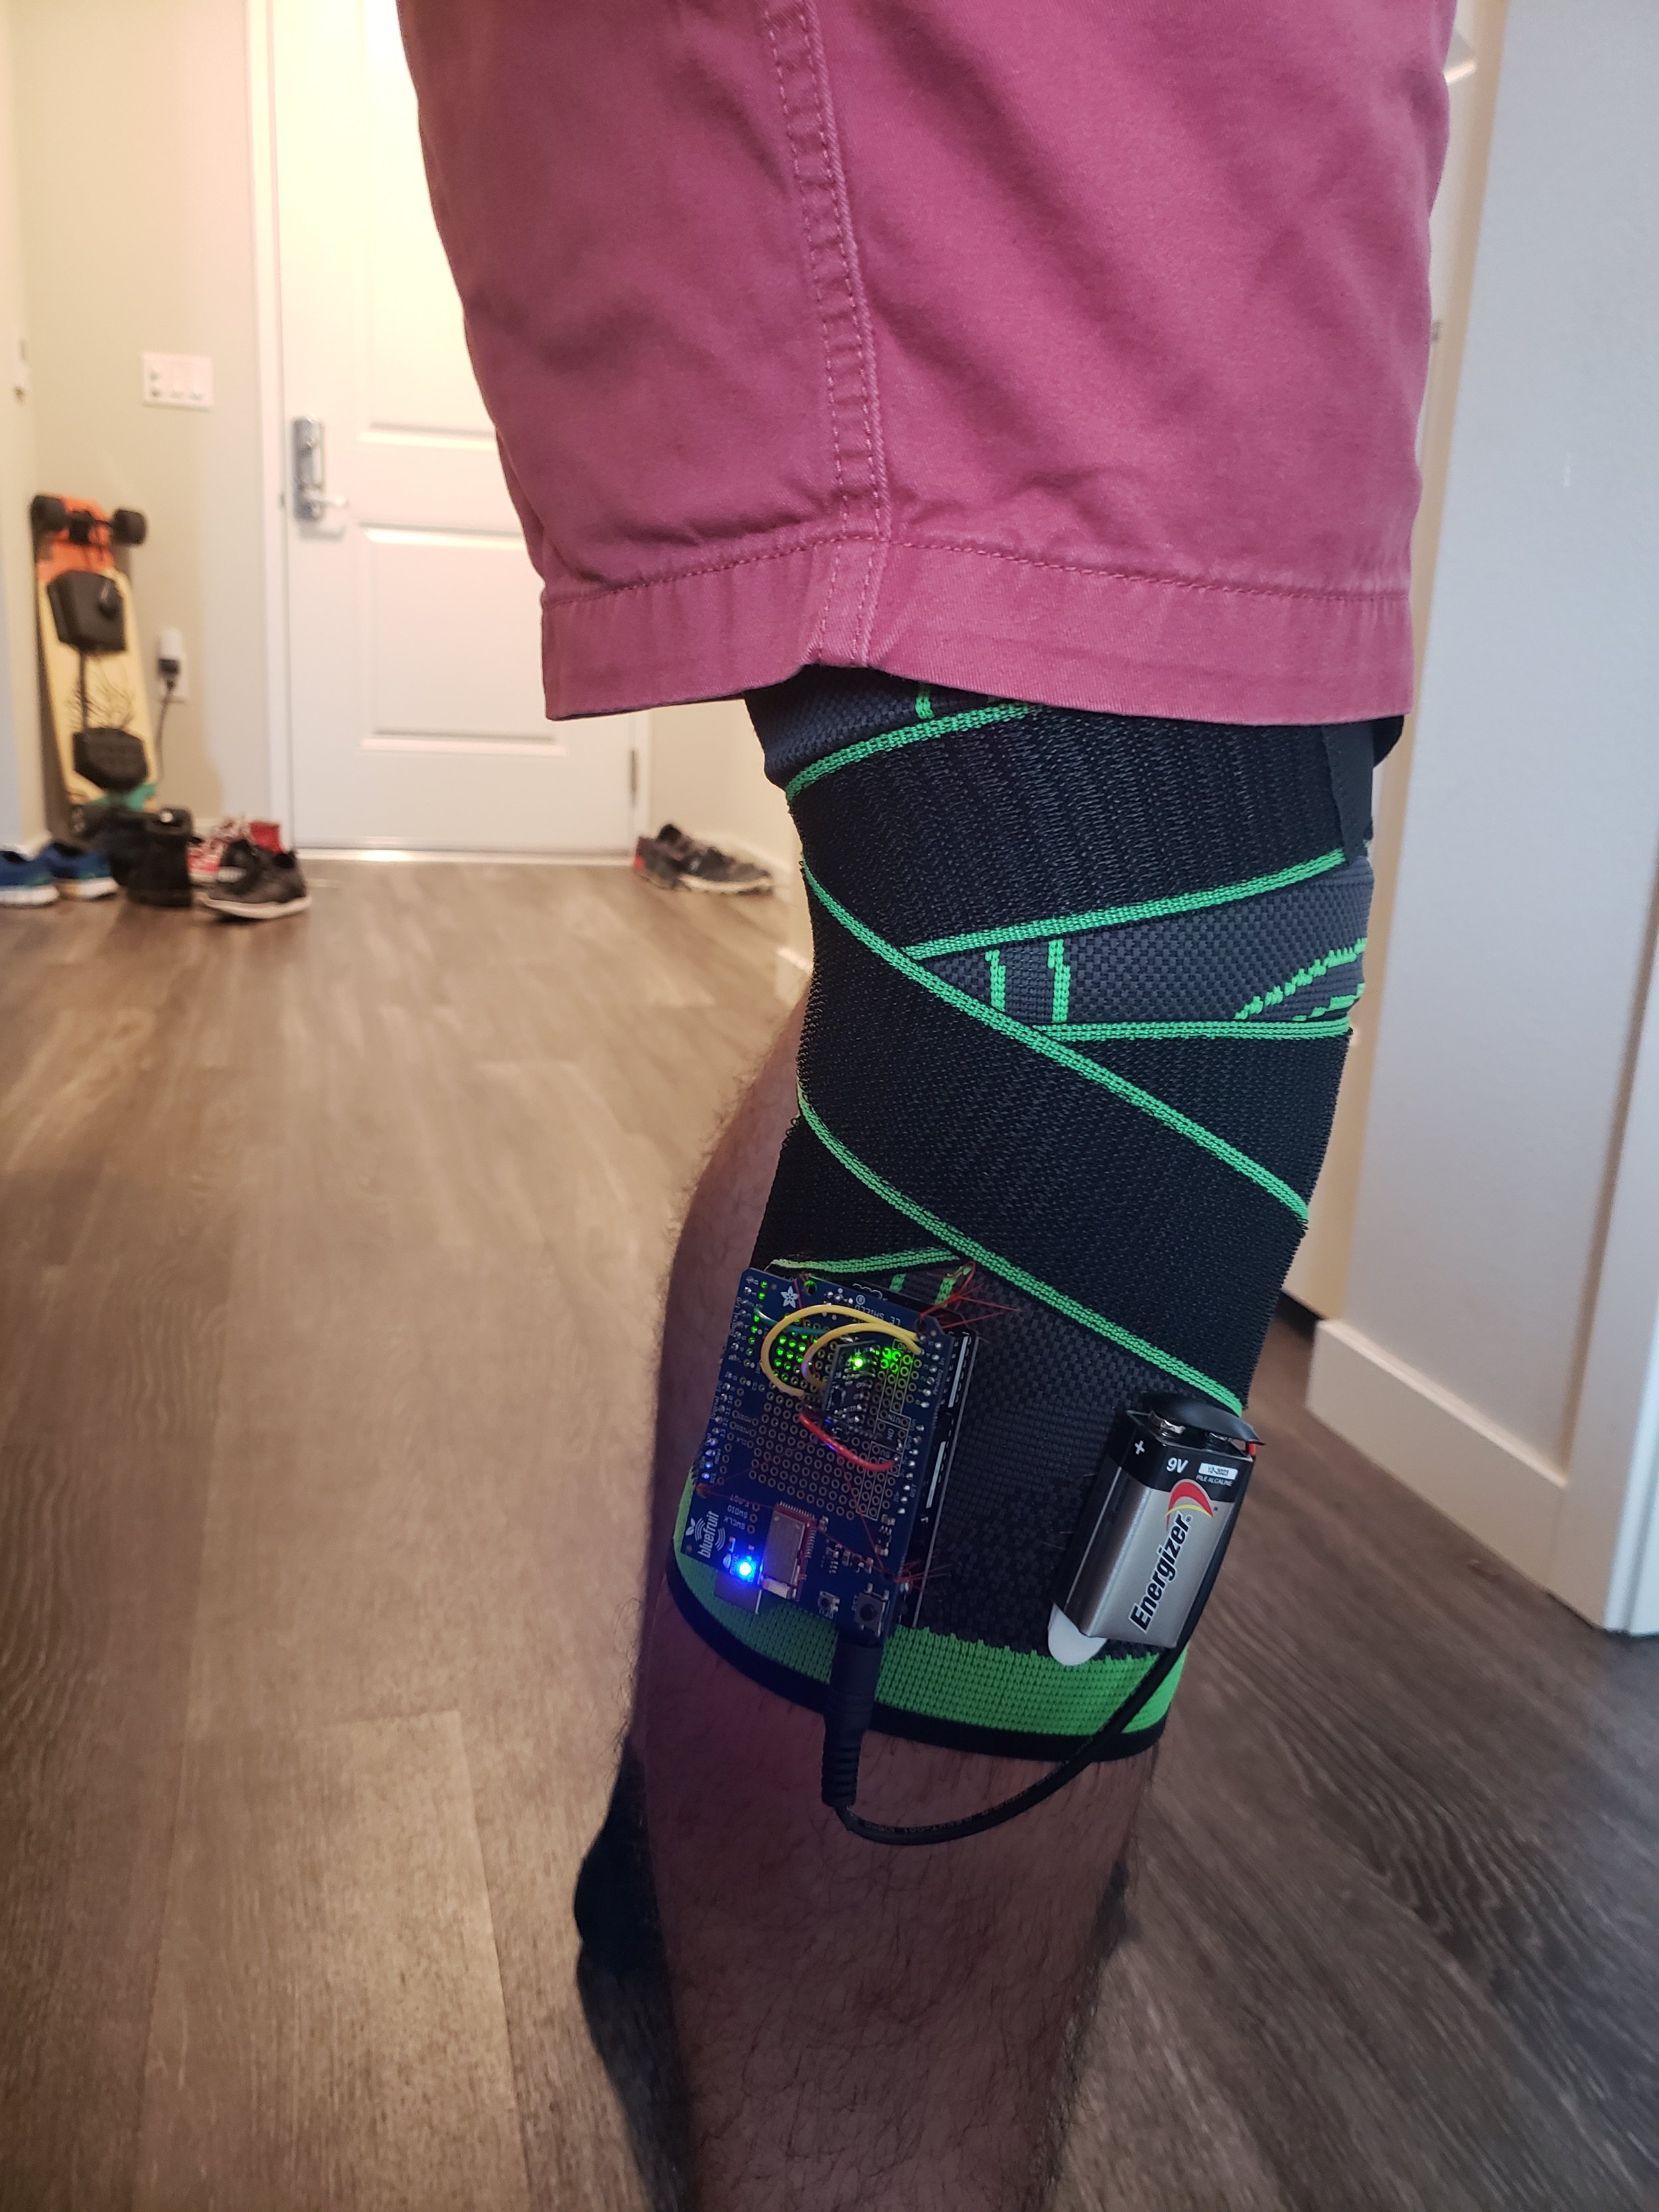
Version 2.0 - now with noise filtering!
In many ways, Version 2.0 is quite a bit “uglier” than Version 1. There are more wires sticking everywhere, the color scheme doesn’t make any sense, and sensors are being held on by command strips, thread, and a lot of hope.
However, this version packs significant and far-reaching improvements both under and above the hood. Let’s start with the exterior:
The device can now be taken on and off without removing your shoe - a major pain point I found while testing Version 1 with coaches and athletes
You can turn it on and off using a switch instead of by unplugging the battery
The strap no longer interferes with running or sports at all (the old one chafed after about 2 miles on the treadmill)
The entire setup is about 1/2 the weight of the first version
Moving to the internals, the situation is even better, resulting in actual usable data that is (mostly) free of major noise and actually captures some useful information about the wearer’s motion:
Battery life has been improved to over 50 hours of constant operation.
The sensor now has a Kalman filter reducing noise and smoothing data values
Data is now plotting in real time instead of just sending raw numbers over Bluetooth UART
Instead of using poorly-documented functions pulled from Github, the Arduino is now directly interfacing with the IMU, which allows for increased customization, more control over sensor behavior, and a faster run time
Data is now being transmitted at about 300 samples per second - a 6x improvement over version 1
Overall, a good result!

It’s Never That Easy
Moving into the benchtop prototype, I quickly realized two things:
Collecting accurate, actionable data is way harder than it seems at first glance
I don’t know how to code for Arduino
Luckily, Problem 2 could be solved over the course of a few afternoons, so I after some quality time watching YouTube tutorials, browsing StackExchange, and trawling through Github for helpful code snippets, I finally had the confidence to write a Version 1.0 Arduino program that could pull data from the MPU-6050 IMU and return values over UART that resembled real forces and accelerations.
Unfortunately, I still wasn’t getting great results, and the product was clunky, even when fitted to a knee sleeve.

Integrating machine learning
At long last, Load, Explode, and Drive was displaying and showing up as coherent data streams on the Bluefruit app.
Here you can see the results of me jumping followed by walking for a short while. Unfortunately, the actual numerical values for force, jerk, and impulse don’t scale well together for easy comparison, so in future versions, I will have to implement something that either plots the data streams separately, or turns each value into a more cloudy quantity similar to what Sparta Science does where they give performance metrics like “Explode: 60” with no additional context or information.
As much as possible, I’d like to stay away from that, since, especially after speaking to Cal Athletics, I’m a big believer that coaches and athletes are smart enough to be given real data and don’t need to play in the kiddie pool, as it were.
The next frontier is implementing machine learning models for the detection of anomalous events. While a rudimentary CART model is already working, I wish to expand to clustering, SVM, and more detailed time series analysis to unlock the true potential of the sensor platform.
Stay tuned for more updates coming soon!
Hypersonic Space-Shot
Liquid Bipropellant Sounding Rocket “Eureka”
The Base11 Space Challenge has inspired students to reach for the edge of space with liquid propulsion for the first time in history. Specifically, to design, build, and fly a liquid bipropellant rocket to an altitude of 100km above sea level.
In my role as Chief Engineer for Space Enterprise at Berkeley, I personally developed dozens of components and integrated systems for the Eureka-1 rocket, including primary design of the combustion chamber, nozzle, pressurization system, aerodynamic surfaces, nose cone thermal protection, and radio communications system, as well as primary flight simulation including Monte-Carlo landing site prediction.
In addition to the components I designed, I led and oversaw the PDR and CDR process for all rocket components and integrated systems, gaining familiarity with sensors and data acquisition, composite structure design and fabrication, liquid bipropellant injectors, loading & handling procedures for LOX and LPG, additive manufacturing processes including DMLS and SLA, and CNC machining.

Eureka-1 BURNS FOR SPACE
Before I gained funding for the project or additional collaborators, I published and presented the results of my feasibility design study in the 2018 IEEE Aerospace Conference. The link to that design study including the full text of my paper is available here.

Multi-Composite carbon nozzle
Building on the legacy of “Sparky”, Eureka will utilize a carbon-fiber overwrapped composite nozzle that uses CFoam-30 as a refractory non-ablative thermal barrier and chamber liner.

MOnte-CArlo Flight Dynamics & simulation
Utilizing a combination of custom-written simulators and industry-standard tools such as STK and Rocksim Pro, I have simulated and planned Eureka’s flight in anticipation of the FAA flight waiver process.
Pictured: Nominal Flight Trajectory using historical windage data from CUSF 2.5

Systems fabrication
In preparation for static testing, one of two main propellant tanks for the Eureka is inspected and cleaned. These tanks were donated by Samtech International, a title sponsor of Space Enterprise at Berkeley and a major contractor for companies like ULA and SpaceX.
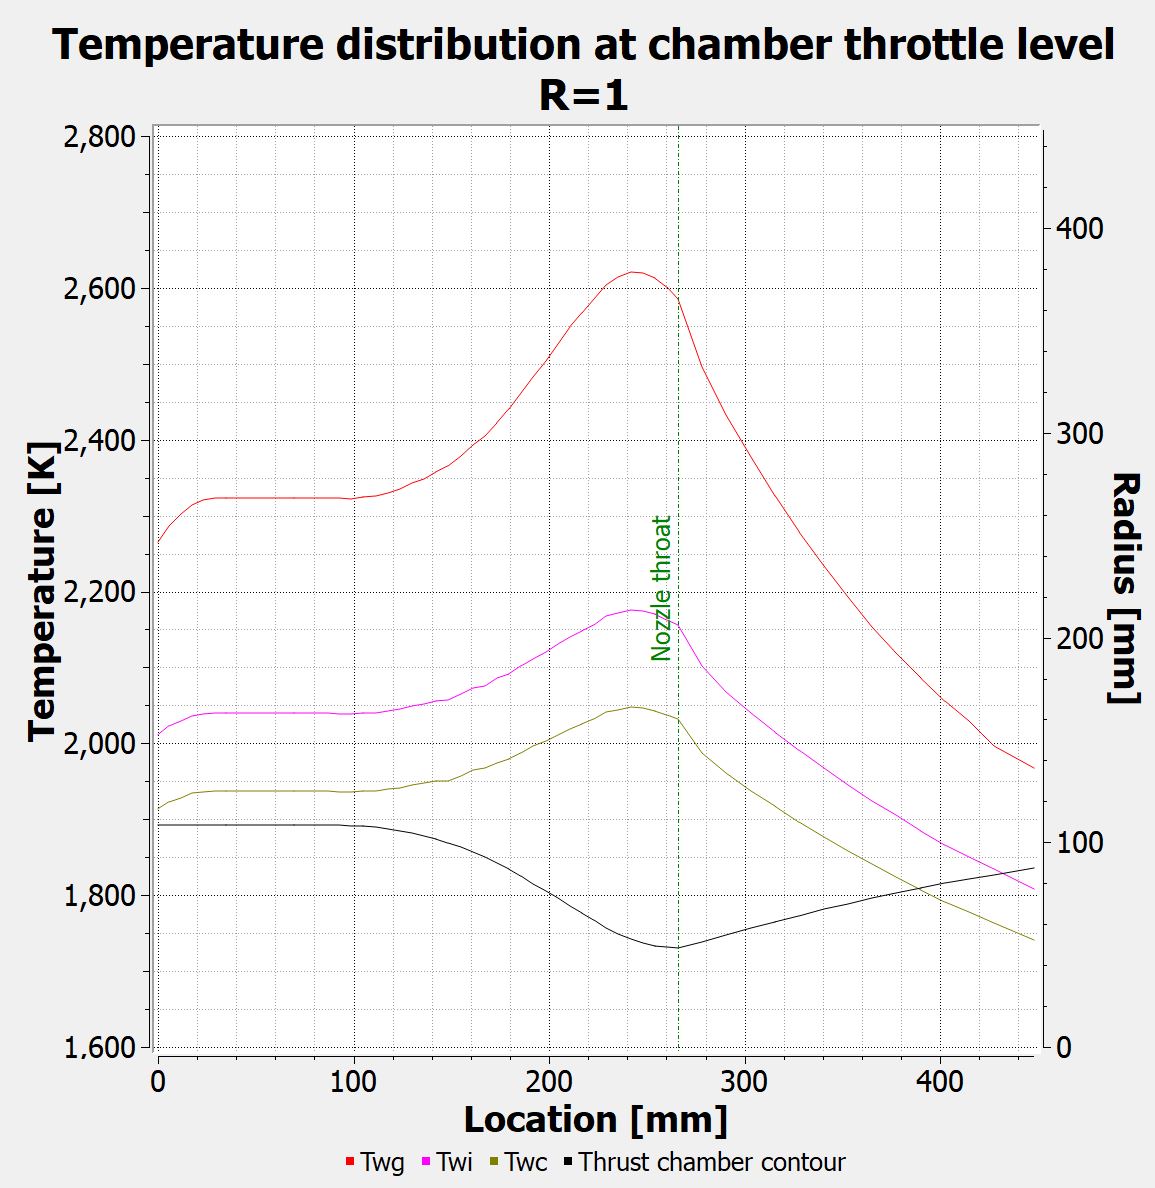
NOZZLE TEMPERATURE SIMULATION
I have conducted detailed analysis of the thermal and mechanical loads on the interior of the rocket nozzle utilizing both vendor-provided product specs and results from empirical testing of sample materials.

Engine transient state modeling
By computing propellant flow rates and gas dynamics over short intervals, I developed a reasonable approximation of the startup behavior of Eureka’s engine system.
Future improvements will consider residence times of propellants in the chamber (current models assume that after combustion, propellants instantly leave the nozzle) and an improved stochastic module incorporating regulator output variability and manufacturing tolerances.

Design reviews
As SEB Chief Engineer, I am responsible for the conceptualization, PDR, and CDR process for all vehicle components, test articles, and ground support equipment.
In this image, I am presenting the PDR for the Eureka-1 propulsion system, a liquid bipropellant utilizing liquid oxygen and sub cooled HD-5 (90% Propane, 5% Butane, 5% Propylene).

Engine Internal stress analysis
Using Classical Lamination Theory and assuming an elastic inner liner (a valid assumption for high-temperature carbon foam), the stress in the exterior Carbon Fiber shell can be computed and solved.

Carbon foam test articles
To verify composite material performance, test samples of the CFoam material, some with additional ablative coatings, thermal insulation barriers, and other similar devices.
This particular sample shows a CFoam disc coated in an ablative furnace cement manufactured by SGL. The cement failed testing because it was discovered that the cement contains binders which outgas during full cure. The outgassing introduces large, unavoidable voids in the final rigidly cured cement.
STAYING COOL AT 2000 DEGREES
The above video shows FLIR footage of one of the heat and chemical resistance tests conducted on the CFoam test articles prepared earlier.
By calibrating the output intensity and chemical composition of an oxy-acetylene torch, we were able to match the thermal and chemical environment found at the throat of Eureka’s liquid engine and determine the amount of insulation required to maintain integrity of the carbon fiber structural shell of the engine.
Use Your Head
Preventing cycling injury one smart helmet at a time
As part of my Industrial Engineering coursework (Design for Human Factors), I developed an incentive-based app and integrated hardware solution to encourage college students to wear helmets while cycling. In addition, the app utilized IMU sensors to extrapolate the rider’s posture and provide biofeedback to prevent injuries due to repetitive strain and poor posture.
This project was completed as a team in my IEOR 170 - “Design for Human Factors” class with Carson Trinh, Lee Chow Liang, Jason Tang, and Tony Li. My primary responsibilities were as team lead and hardware designer (including sensors and communications systems).

Multi-SENSOR NETWORK
While the system was functional with a single sensor designed to fit neatly into the Giro Savant helmet, it could reliably extrapolate body position when paired with a secondary sensor module placed in an ankle strap. Using the IMU’s on board magnetometer and gyroscope, relative leg and neck angles could be determined, allowing us to determine a REBA score for the cyclist, an empirical score typically used to quantify the risk of strain injuries in the workplace.

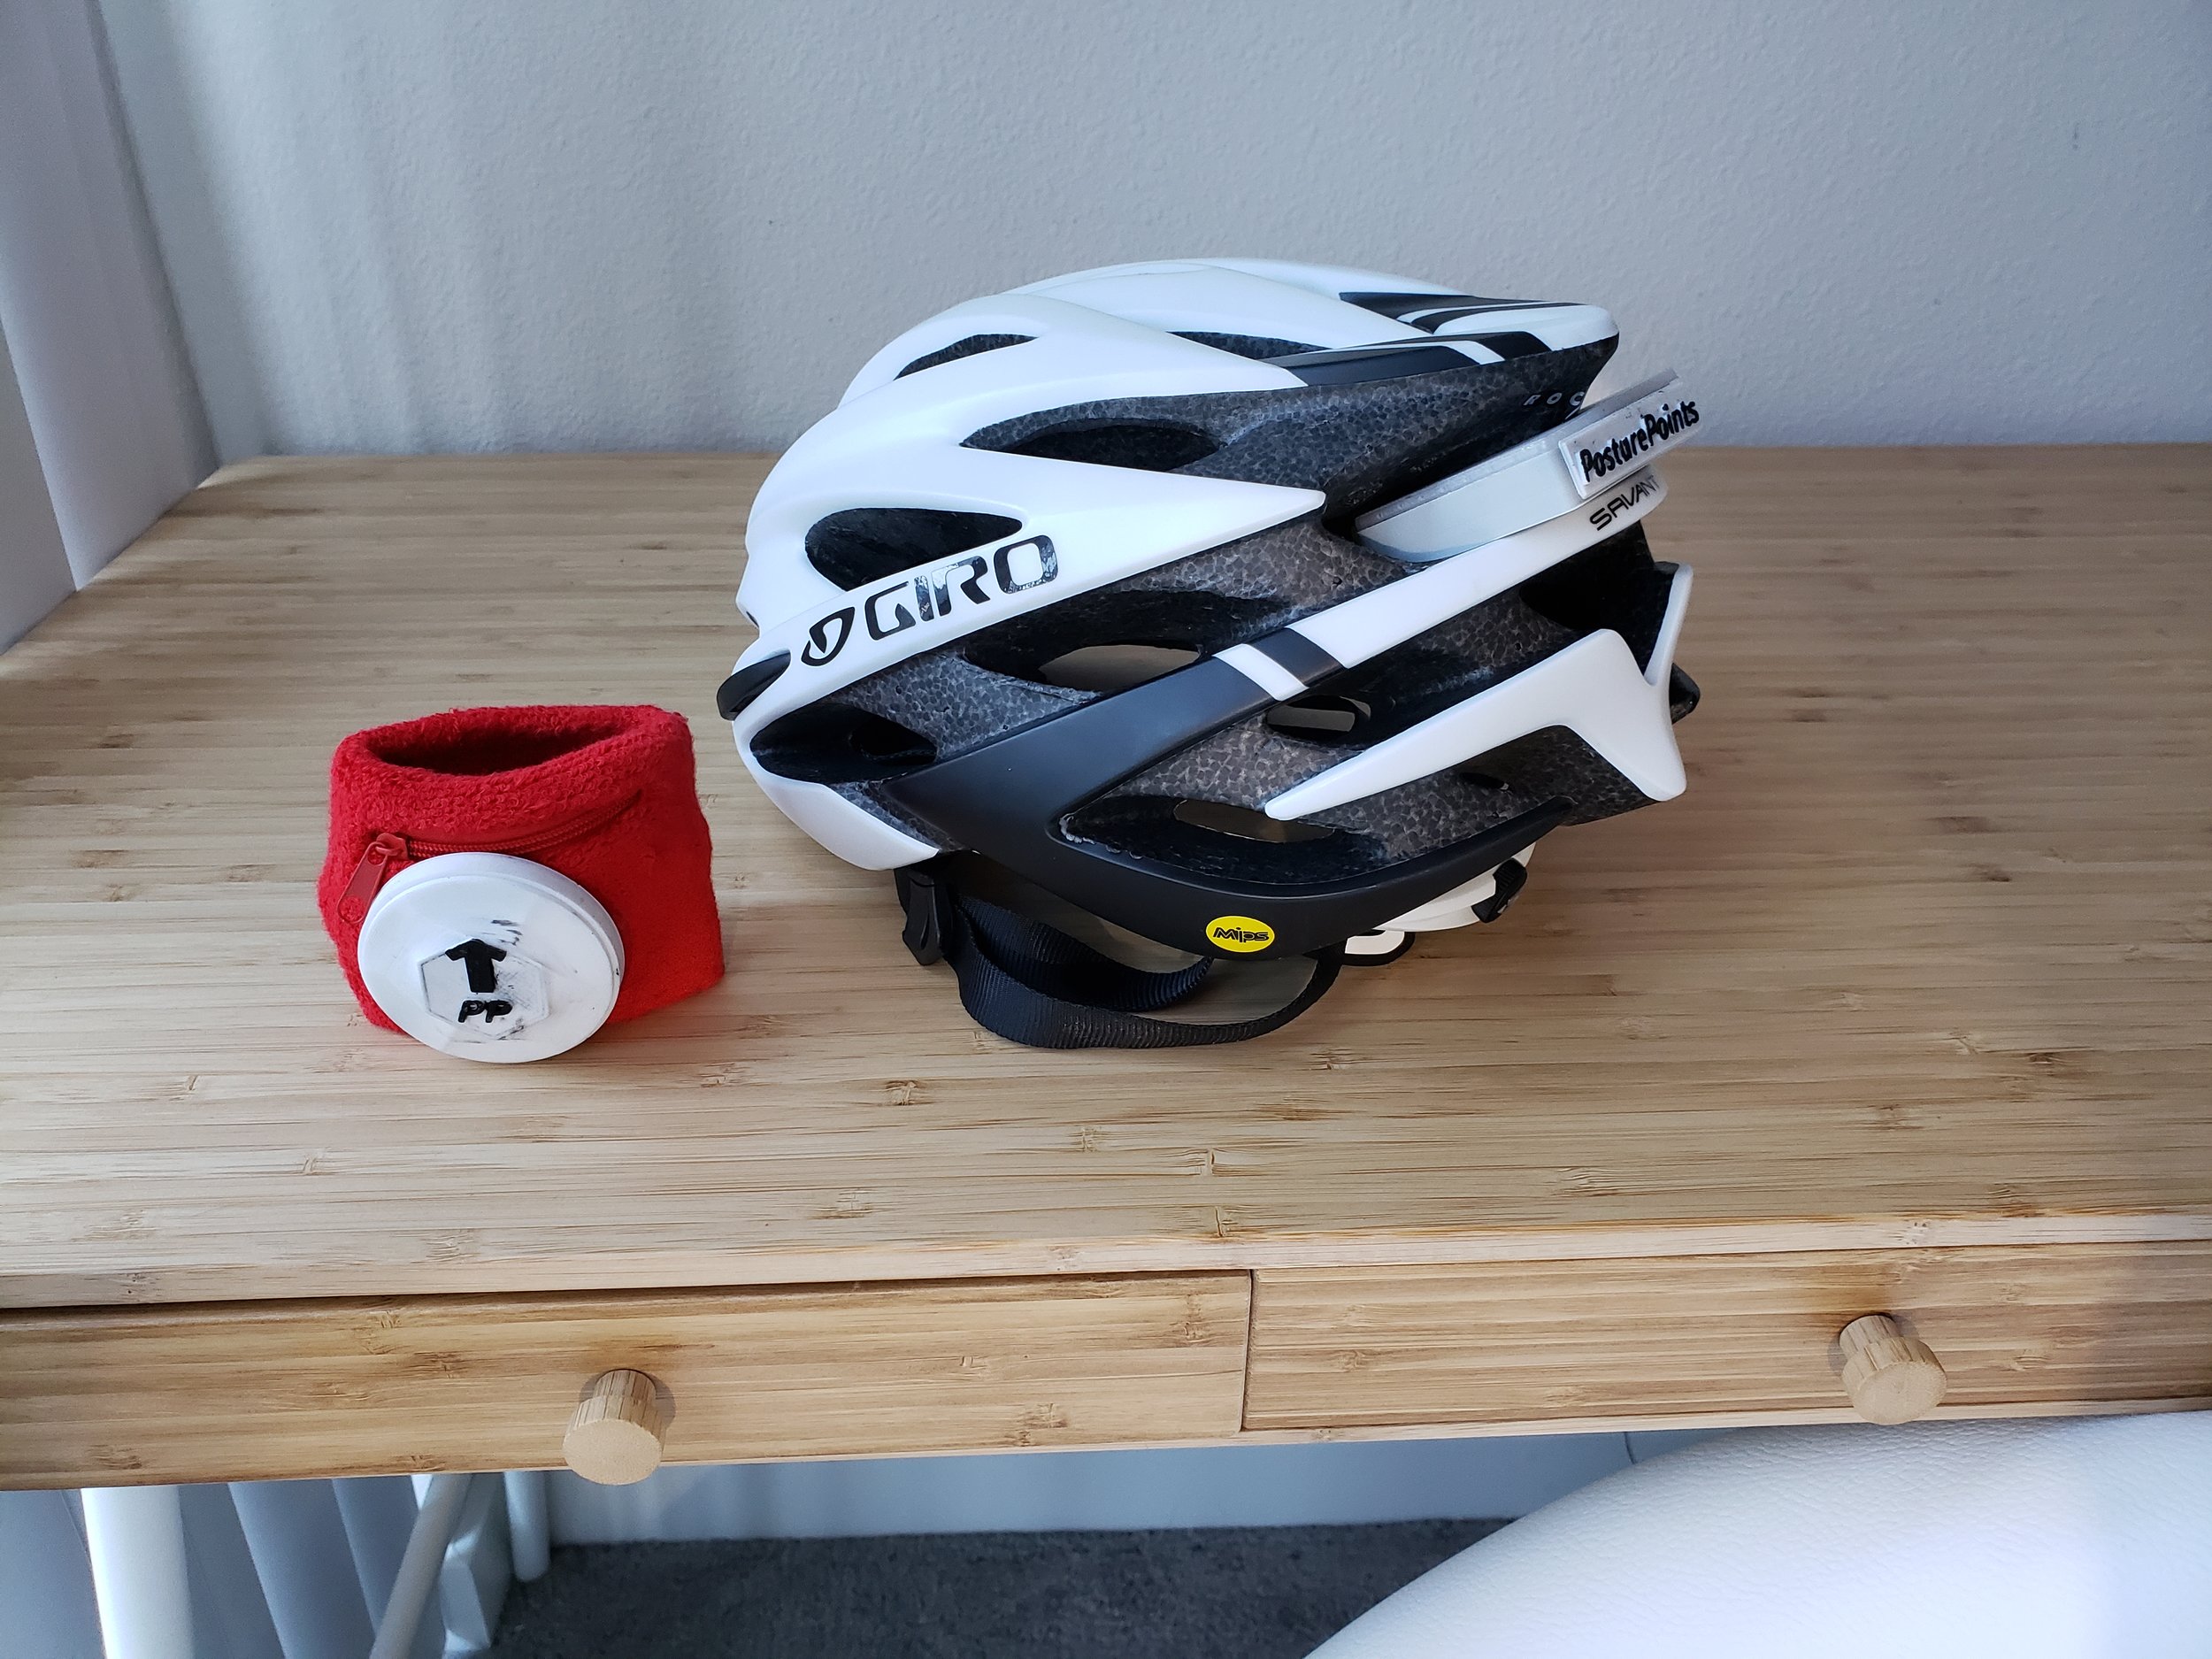
PHYSICAL PROTOTYPE
Using 3D printing and reference models of the Giro Savant helmet, we developed a snug-fitting combined module (top right) that remained firmly in place even when riding over rough terrain.
The helmet module went through several iterations attempting to find a design that fit inside the helmet, could accommodate (mockups) of all the electronic components, and stayed firmly in place. Eventually, I resorted to using clay and calipers - pressing the clay firmly into the gap, letting it harden slightly, and then removing it and measuring it with calipers to find appropriate sizing. Crude, but effective.
The ankle module (bottom left) was a bit more bare-bones, but since we weren’t shape-constrained as severely, we were able to fit a mockup of a significantly larger battery.
Unfortunately, the IEOR department did not provide funding to assist in course projects, so the sensor system never made it past the SolidWorks/Block Diagram/Physical Mockup phase of development.
Still, this project equipped me with the tools to approach the later endeavor (Athletic Performance Tracking) with some degree of confidence. Knowledge of what sensors existed commercially, how they worked, and how they could interface with each other and smart devices was an invaluable learning experience in and of itself.

UI/UX Design for FUnctional Clarity
Utilizing lessons learned on human cognition and attention, we designed a UI/UX that served a dual purpose - communicating valuable information and suggestions on rider posture and incentivizing helmet use and proper posture through a “points” system redeemable for discounts at local restaurants and shops.
Going into this project, I saw UI/UX as a very “soft” discipline, more like art and “design” than actual engineering or science.
However, I quickly realized how wrong that was. Human beings respond in specific ways to stimuli and incentives, and by structuring our app in a pleasing way that conveyed information easily and had a good flow between elements, we could accomplish our design goal of increasing safety much more effectively.